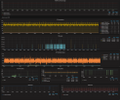
Telegraf: system dashboard 1,3841,384
Description
Prometheus/victoriametrics dashboards for telegraf metrics
Screenshots
Used Metrics 116116
conntrack_ip_conntrack_count
conntrack_ip_conntrack_max
cpu_usage_guest
cpu_usage_guest_nice
cpu_usage_idle
cpu_usage_iowait
cpu_usage_irq
cpu_usage_nice
cpu_usage_softirq
cpu_usage_steal
cpu_usage_system
cpu_usage_user
disk_inodes_free
disk_inodes_used
disk_total
disk_used
disk_used_percent
diskio_read_bytes
diskio_read_time
diskio_reads
diskio_write_bytes
diskio_write_time
diskio_writes
ideriv
internal_agent_gather_errors
internal_agent_metrics_dropped
internal_agent_metrics_written
internal_gather_gather_time_ns
internal_write_write_time_ns
interrupts_total
kernel_context_switches
kernel_processes_forked
linux_sysctl_fs_file
median
mem_buffered
mem_cached
mem_free
mem_total
mem_used
mem_used_percent
net_bytes_recv
net_bytes_sent
net_drop_in
net_drop_out
net_err_in
net_err_out
net_packets_recv
net_packets_sent
net_tcp_activeopens
net_tcp_estabresets
net_tcp_outrsts
net_tcp_passiveopens
net_udp_indatagrams
net_udp_outdatagrams
netstat_tcp_close
netstat_tcp_close_wait
netstat_tcp_closing
netstat_tcp_established
netstat_tcp_fin_wait1
netstat_tcp_fin_wait2
netstat_tcp_last_ack
netstat_tcp_syn_recv
netstat_tcp_syn_sent
netstat_tcp_time_wait
nr
nstat_IcmpInCsumErrors
nstat_IcmpInEchoReps
nstat_IcmpInEchos
nstat_IcmpInErrors
nstat_IcmpOutEchoReps
nstat_IcmpOutEchos
nstat_IcmpOutErrors
nstat_Ip6InAddrErrors
nstat_Ip6InDiscards
nstat_Ip6InHdrErrors
nstat_Ip6InUnknownProtos
nstat_Ip6OutDiscards
nstat_Ip6OutNoRoutes
nstat_IpInAddrErrors
nstat_IpInDiscards
nstat_IpInHdrErrors
nstat_IpInUnknownProtos
nstat_IpOutDiscards
nstat_IpOutNoRoutes
nstat_TcpExtSyncookiesFailed
nstat_TcpExtSyncookiesRecv
nstat_TcpExtSyncookiesSent
nstat_TcpExtTCPAbortFailed
nstat_TcpExtTCPAbortOnClose
nstat_TcpExtTCPAbortOnData
nstat_TcpExtTCPAbortOnLinger
nstat_TcpExtTCPAbortOnMemory
nstat_TcpExtTCPAbortOnTimeout
nstat_UdpInCsumErrors
nstat_UdpInErrors
nstat_UdpNoPorts
nstat_UdpRcvbufErrors
nstat_UdpSndbufErrors
processes_blocked
processes_paging
processes_running
processes_sleeping
processes_stopped
processes_total
processes_total_threads
processes_unknown
processes_zombies
swap_in
swap_out
swap_total
swap_used
swap_used_percent
system_load1
system_load15
system_load5
system_uptime