Synology SNMP 1,8641,864
5/1/2023
5/1/2023
1
>=9.4.7
Prometheus
Description
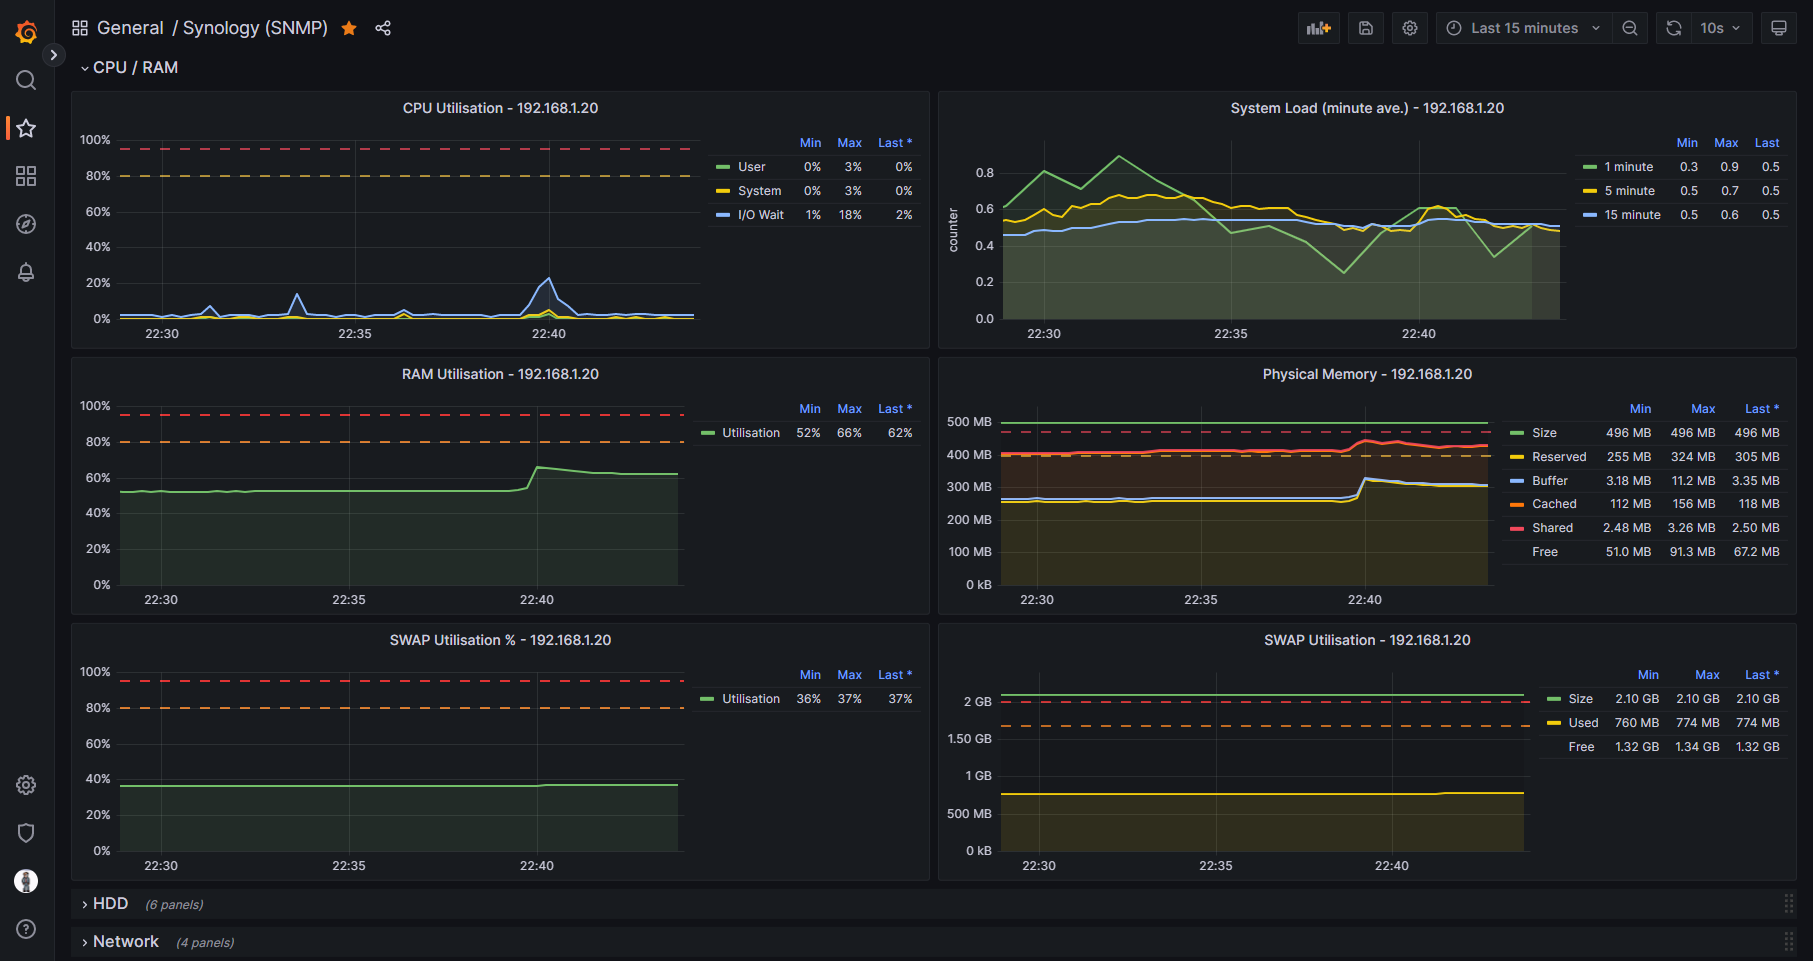
Dashboard for viewing Synology System Information using Prometheus and SNMP_Exporter
Screenshots
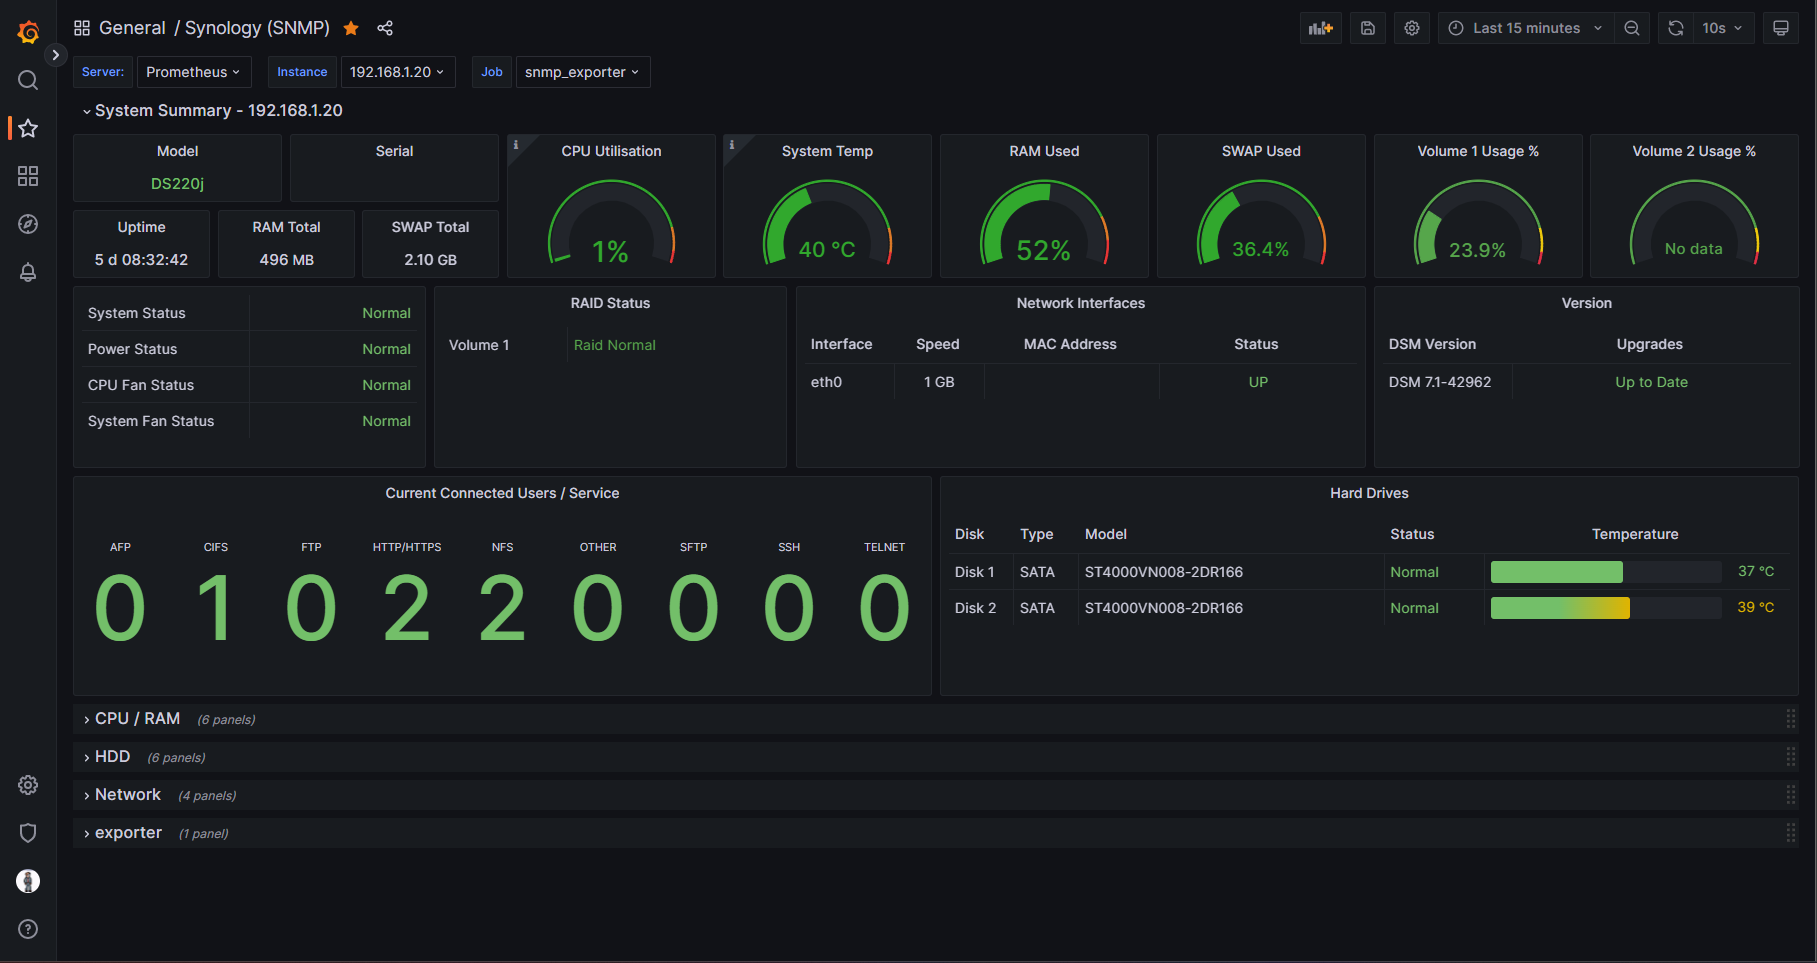
Used Metrics 4444
cpuFanStatus
diskIONReadX
diskIONWrittenX
diskIOReads
diskIOWrites
diskModel
diskStatus
diskTemperature
diskType
hrSystemUptime
ifHCInOctets
ifHCOutOctets
ifInDiscards
ifInErrors
ifOperStatus
ifOutDiscards
ifOutErrors
ifPhysAddress
ifSpeed
interfacebits
laLoadInt
memAvailReal
memAvailSwap
memBuffer
memCached
memShared
memTotalReal
memTotalSwap
modelName
powerStatus
raidFreeSize
raidStatus
raidTotalSize
serialNumber
serviceUsers
snmp_scrape_duration_seconds
ssCpuIdle
ssCpuSystem
ssCpuUser
systemFanStatus
systemStatus
temperature
upgradeAvailable
version
Get Dashboard✕
Download
Copy to Clipboard