swagger-stats dashboard v3 5,3935,393 5.0 (1 reviews)
9/2/2017
10/6/2020
4
Web Servers
>=7.2.0
Prometheus
Description
Swagger-Stats Main Dashboard Revision 3
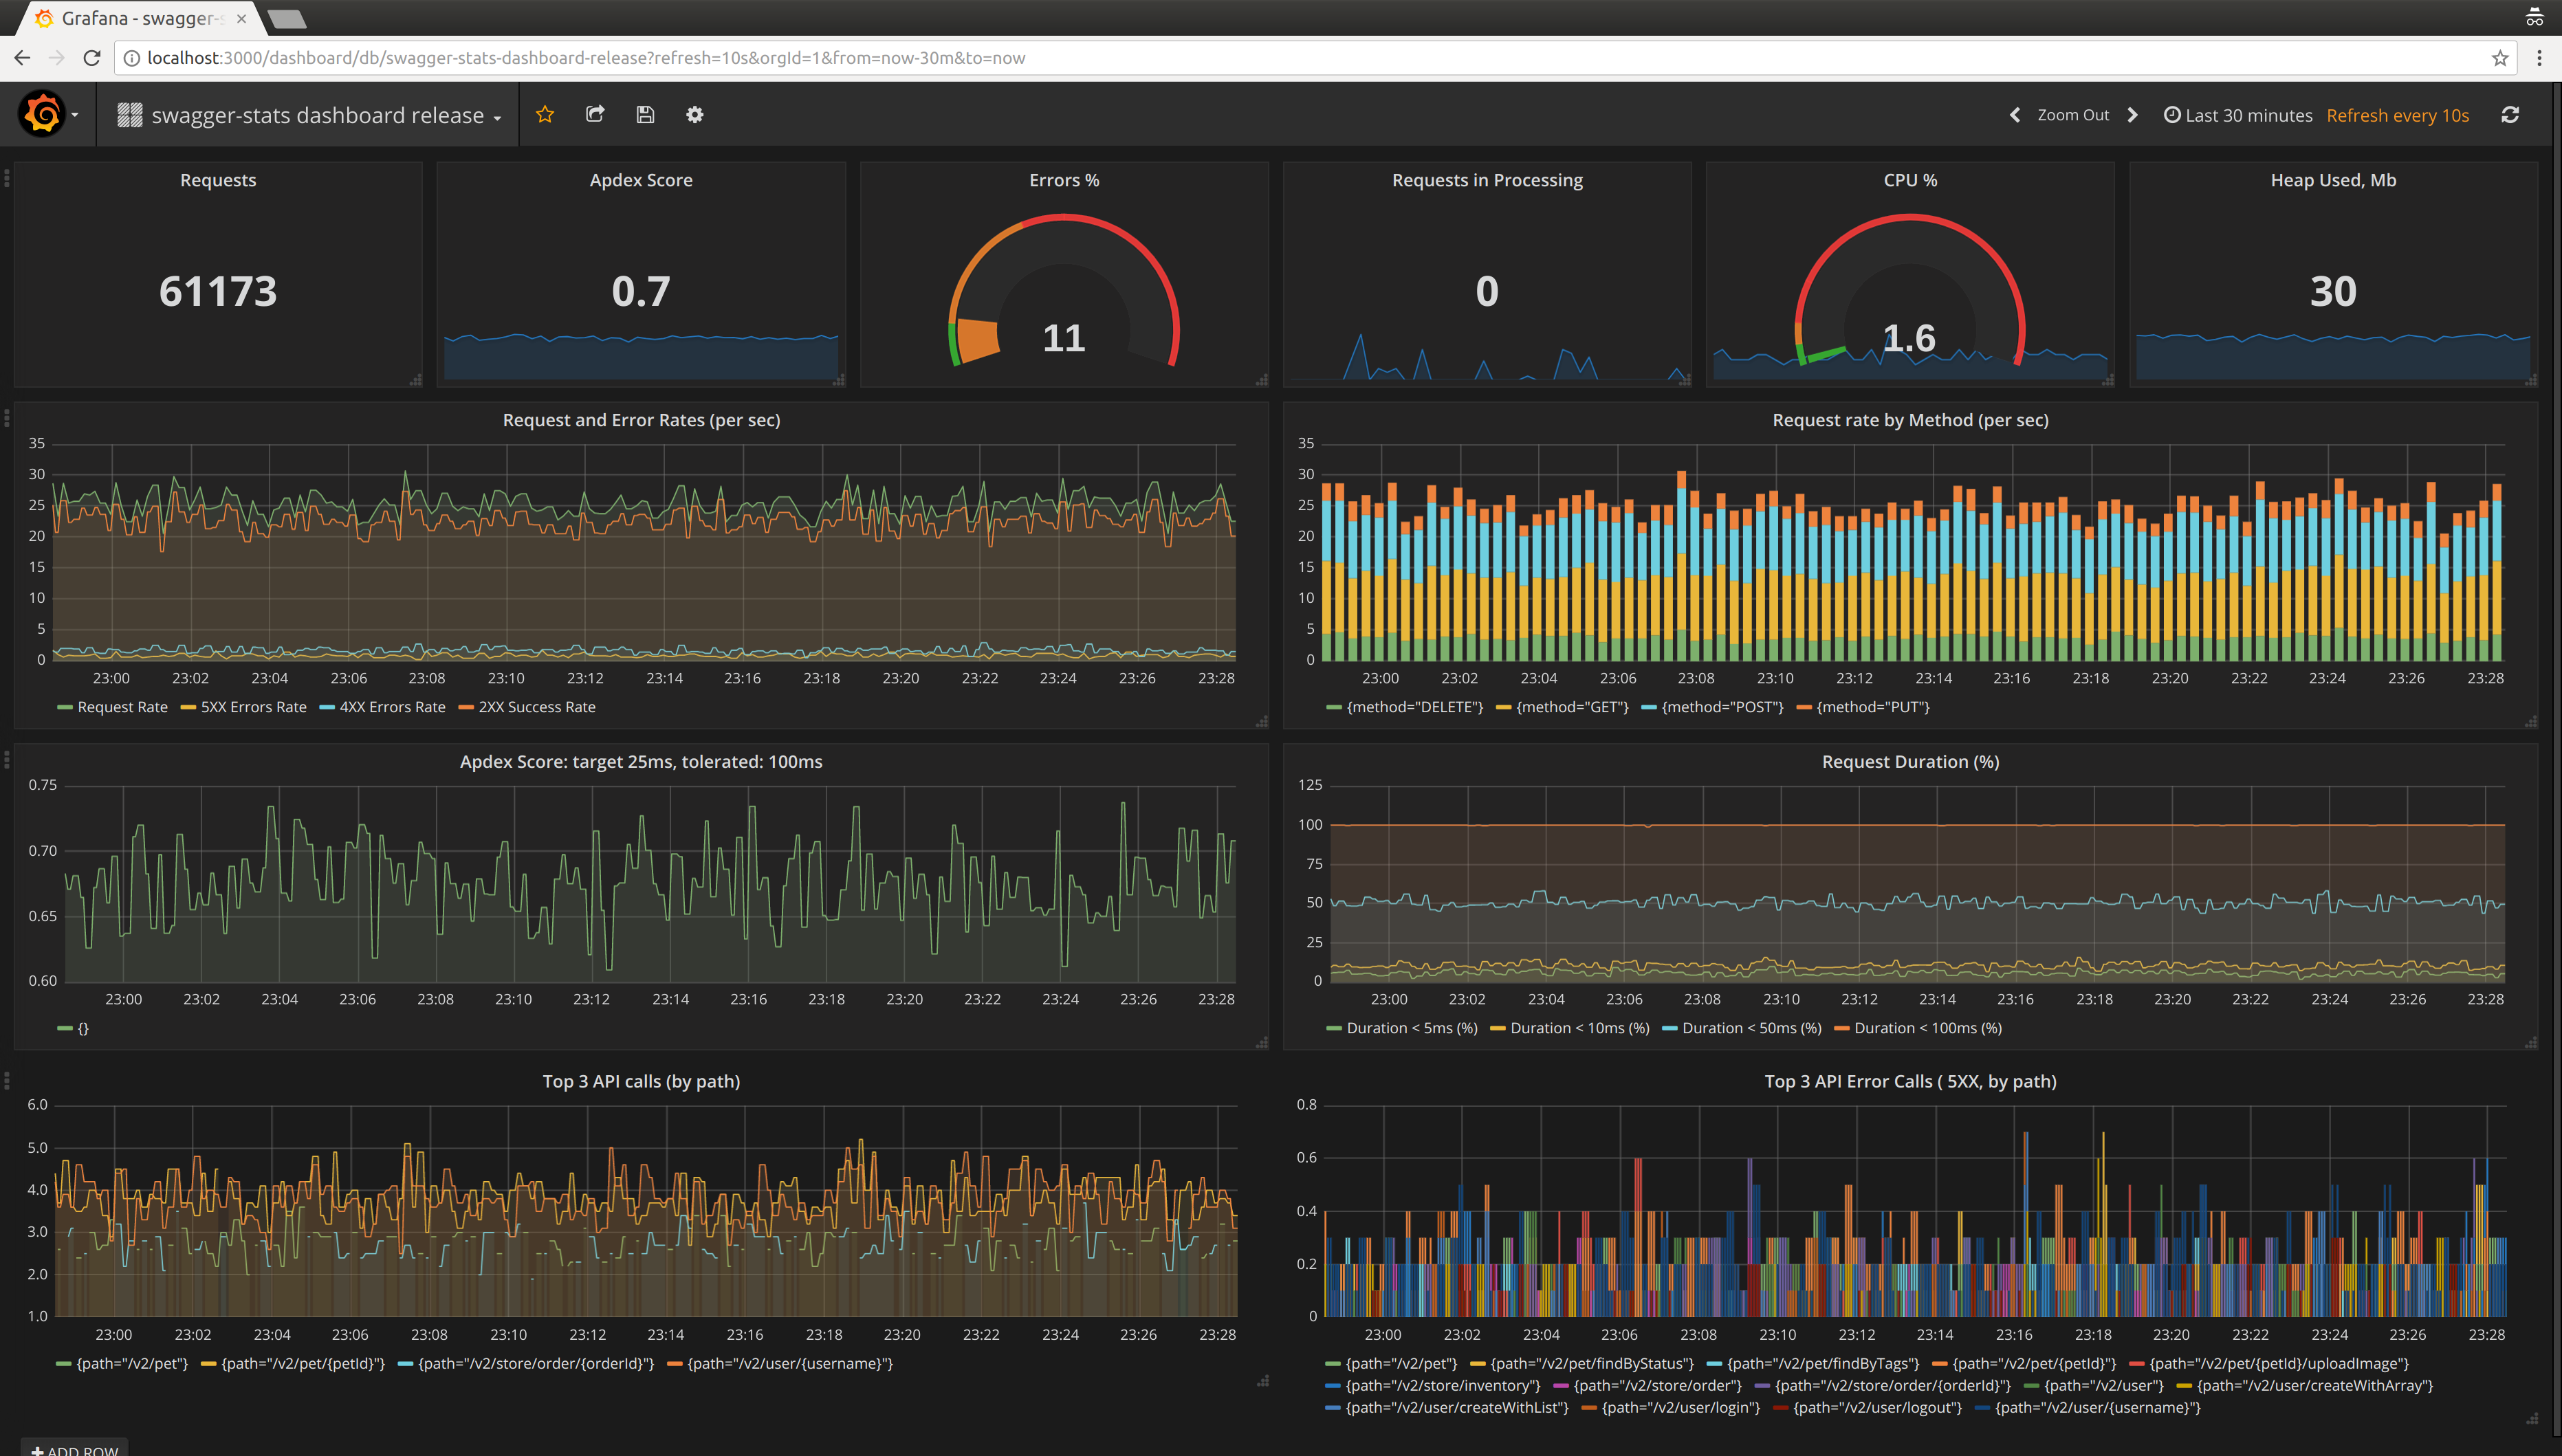
Screenshots
Used Metrics 99
api_all_errors_total
api_all_request_in_processing_total
api_all_request_total
api_request_duration_milliseconds_bucket
api_request_duration_milliseconds_count
api_request_total
nodejs_process_cpu_usage_percentage
nodejs_process_memory_heap_used_bytes
topk
Get Dashboard✕
Download
Copy to Clipboard