Storj-Exporter-Boom-Table-combined 792792 5.0 (1 reviews)
2/17/2021
2/19/2021
3
>=7.4.1
Prometheus
Description
Screenshots

Used Metrics 1818
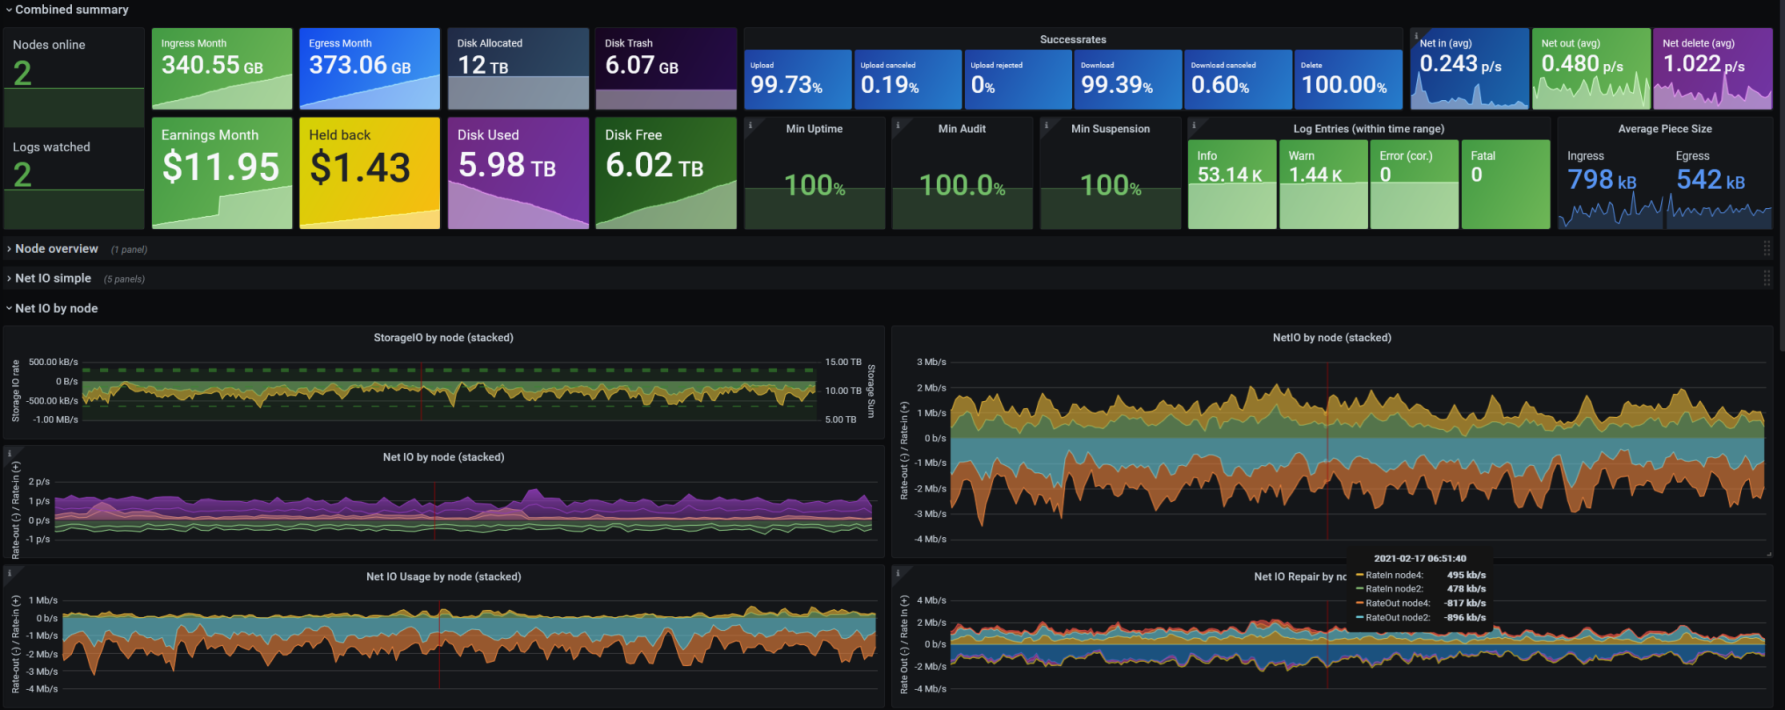
storj_log_errors
storj_log_levels
storj_nodeID_info
storj_payout_currentMonth
storj_pieces_delete_failed
storj_pieces_delete_successful
storj_pieces_download_canceled
storj_pieces_download_started
storj_pieces_download_successful
storj_pieces_upload_canceled
storj_pieces_upload_rejected
storj_pieces_upload_started
storj_pieces_upload_successful
storj_sat_audit
storj_sat_month_egress
storj_sat_month_ingress
storj_sat_summary
storj_total_diskspace
Get Dashboard✕
Download
Copy to Clipboard