Storage I/O Statistics 11,22611,226 4.0 (1 reviews)
2/25/2020
2/27/2020
1
Host Metrics
>=6.6.2
Prometheus
Description
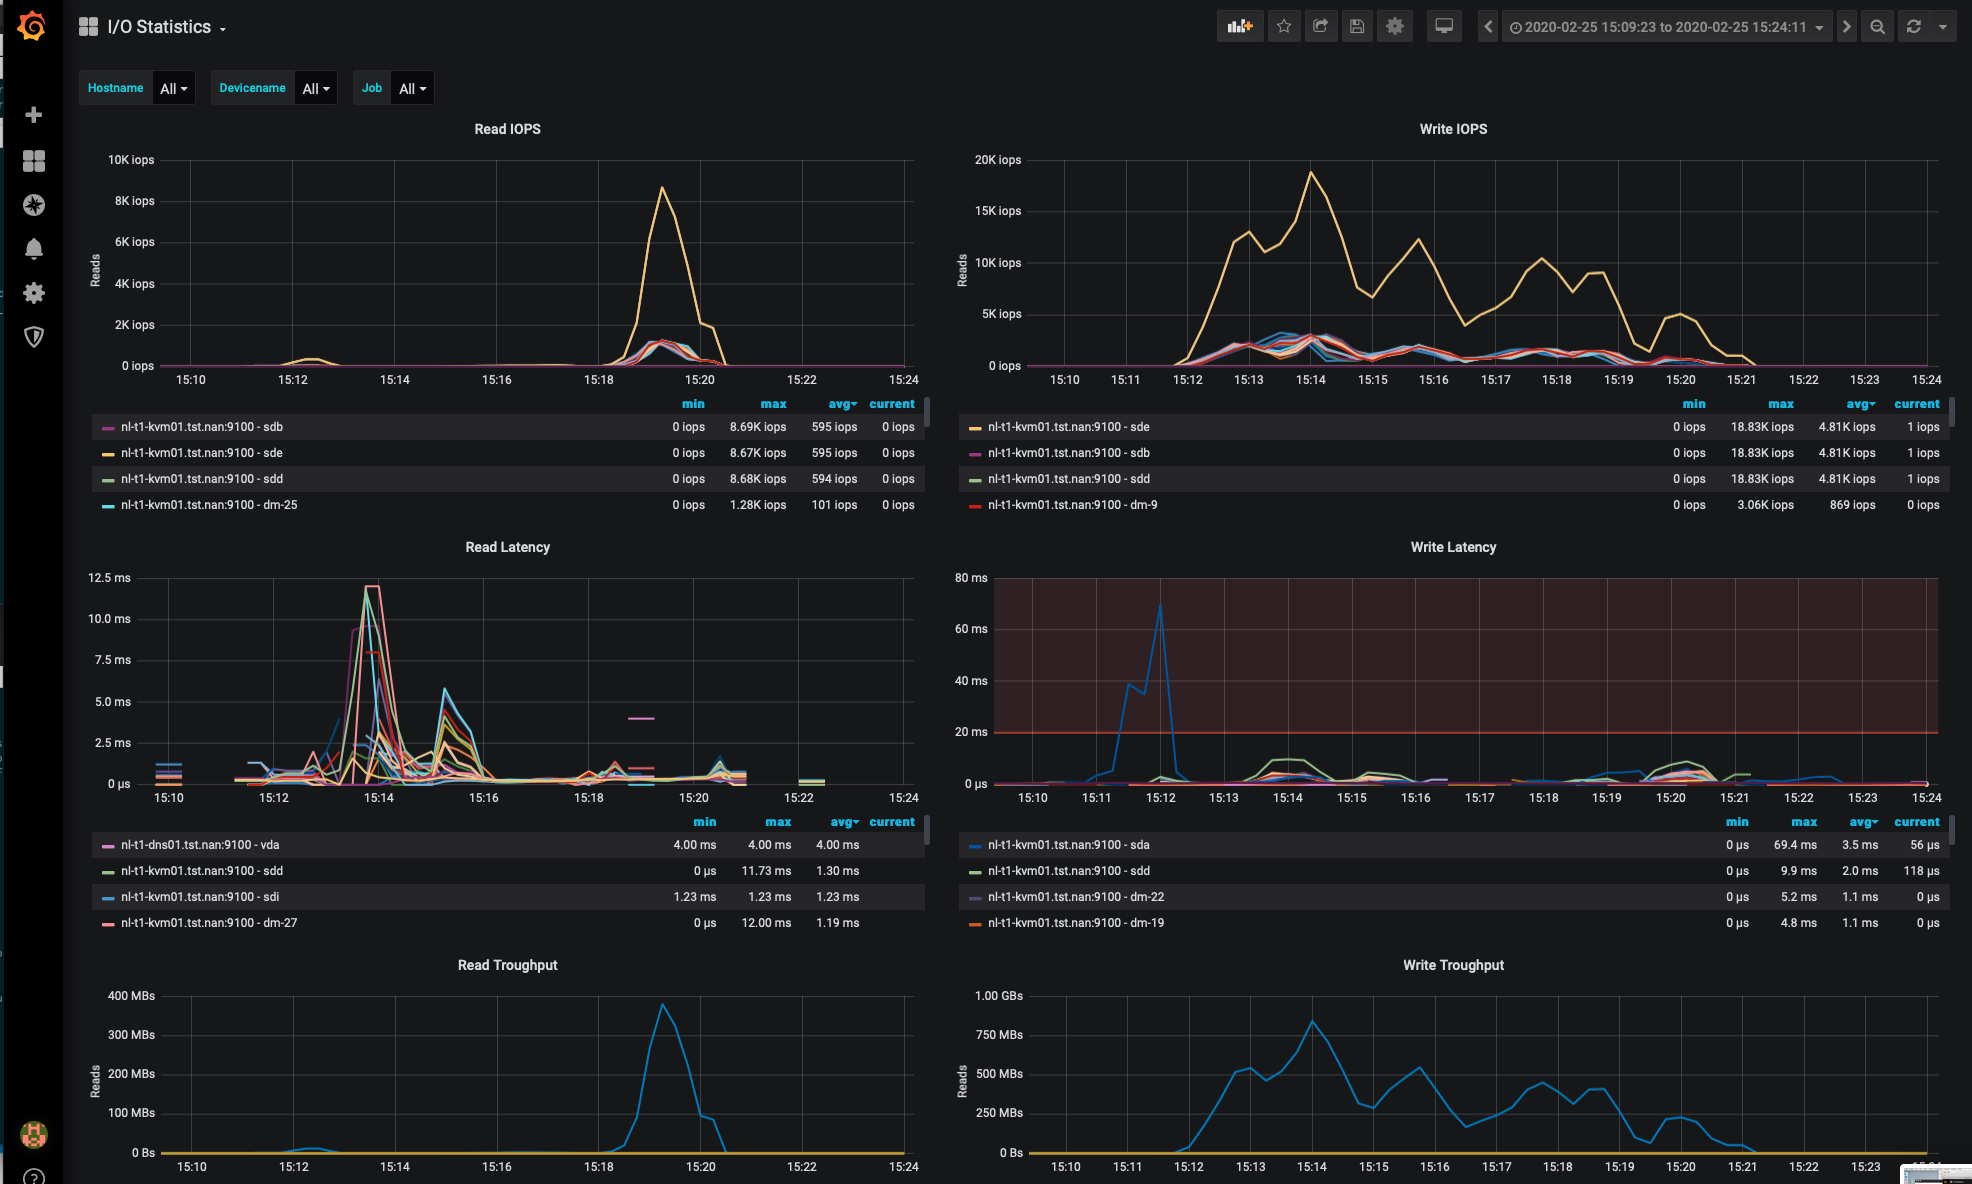
This dashboards shows IOPS, I/O Latency, Average Request size and throughput. Alerts are configured for latency.
Screenshots
Get Dashboard✕
Download
Copy to Clipboard