Standard Namespace Monitoring 7,1577,157 5.0 (1 reviews)
Description
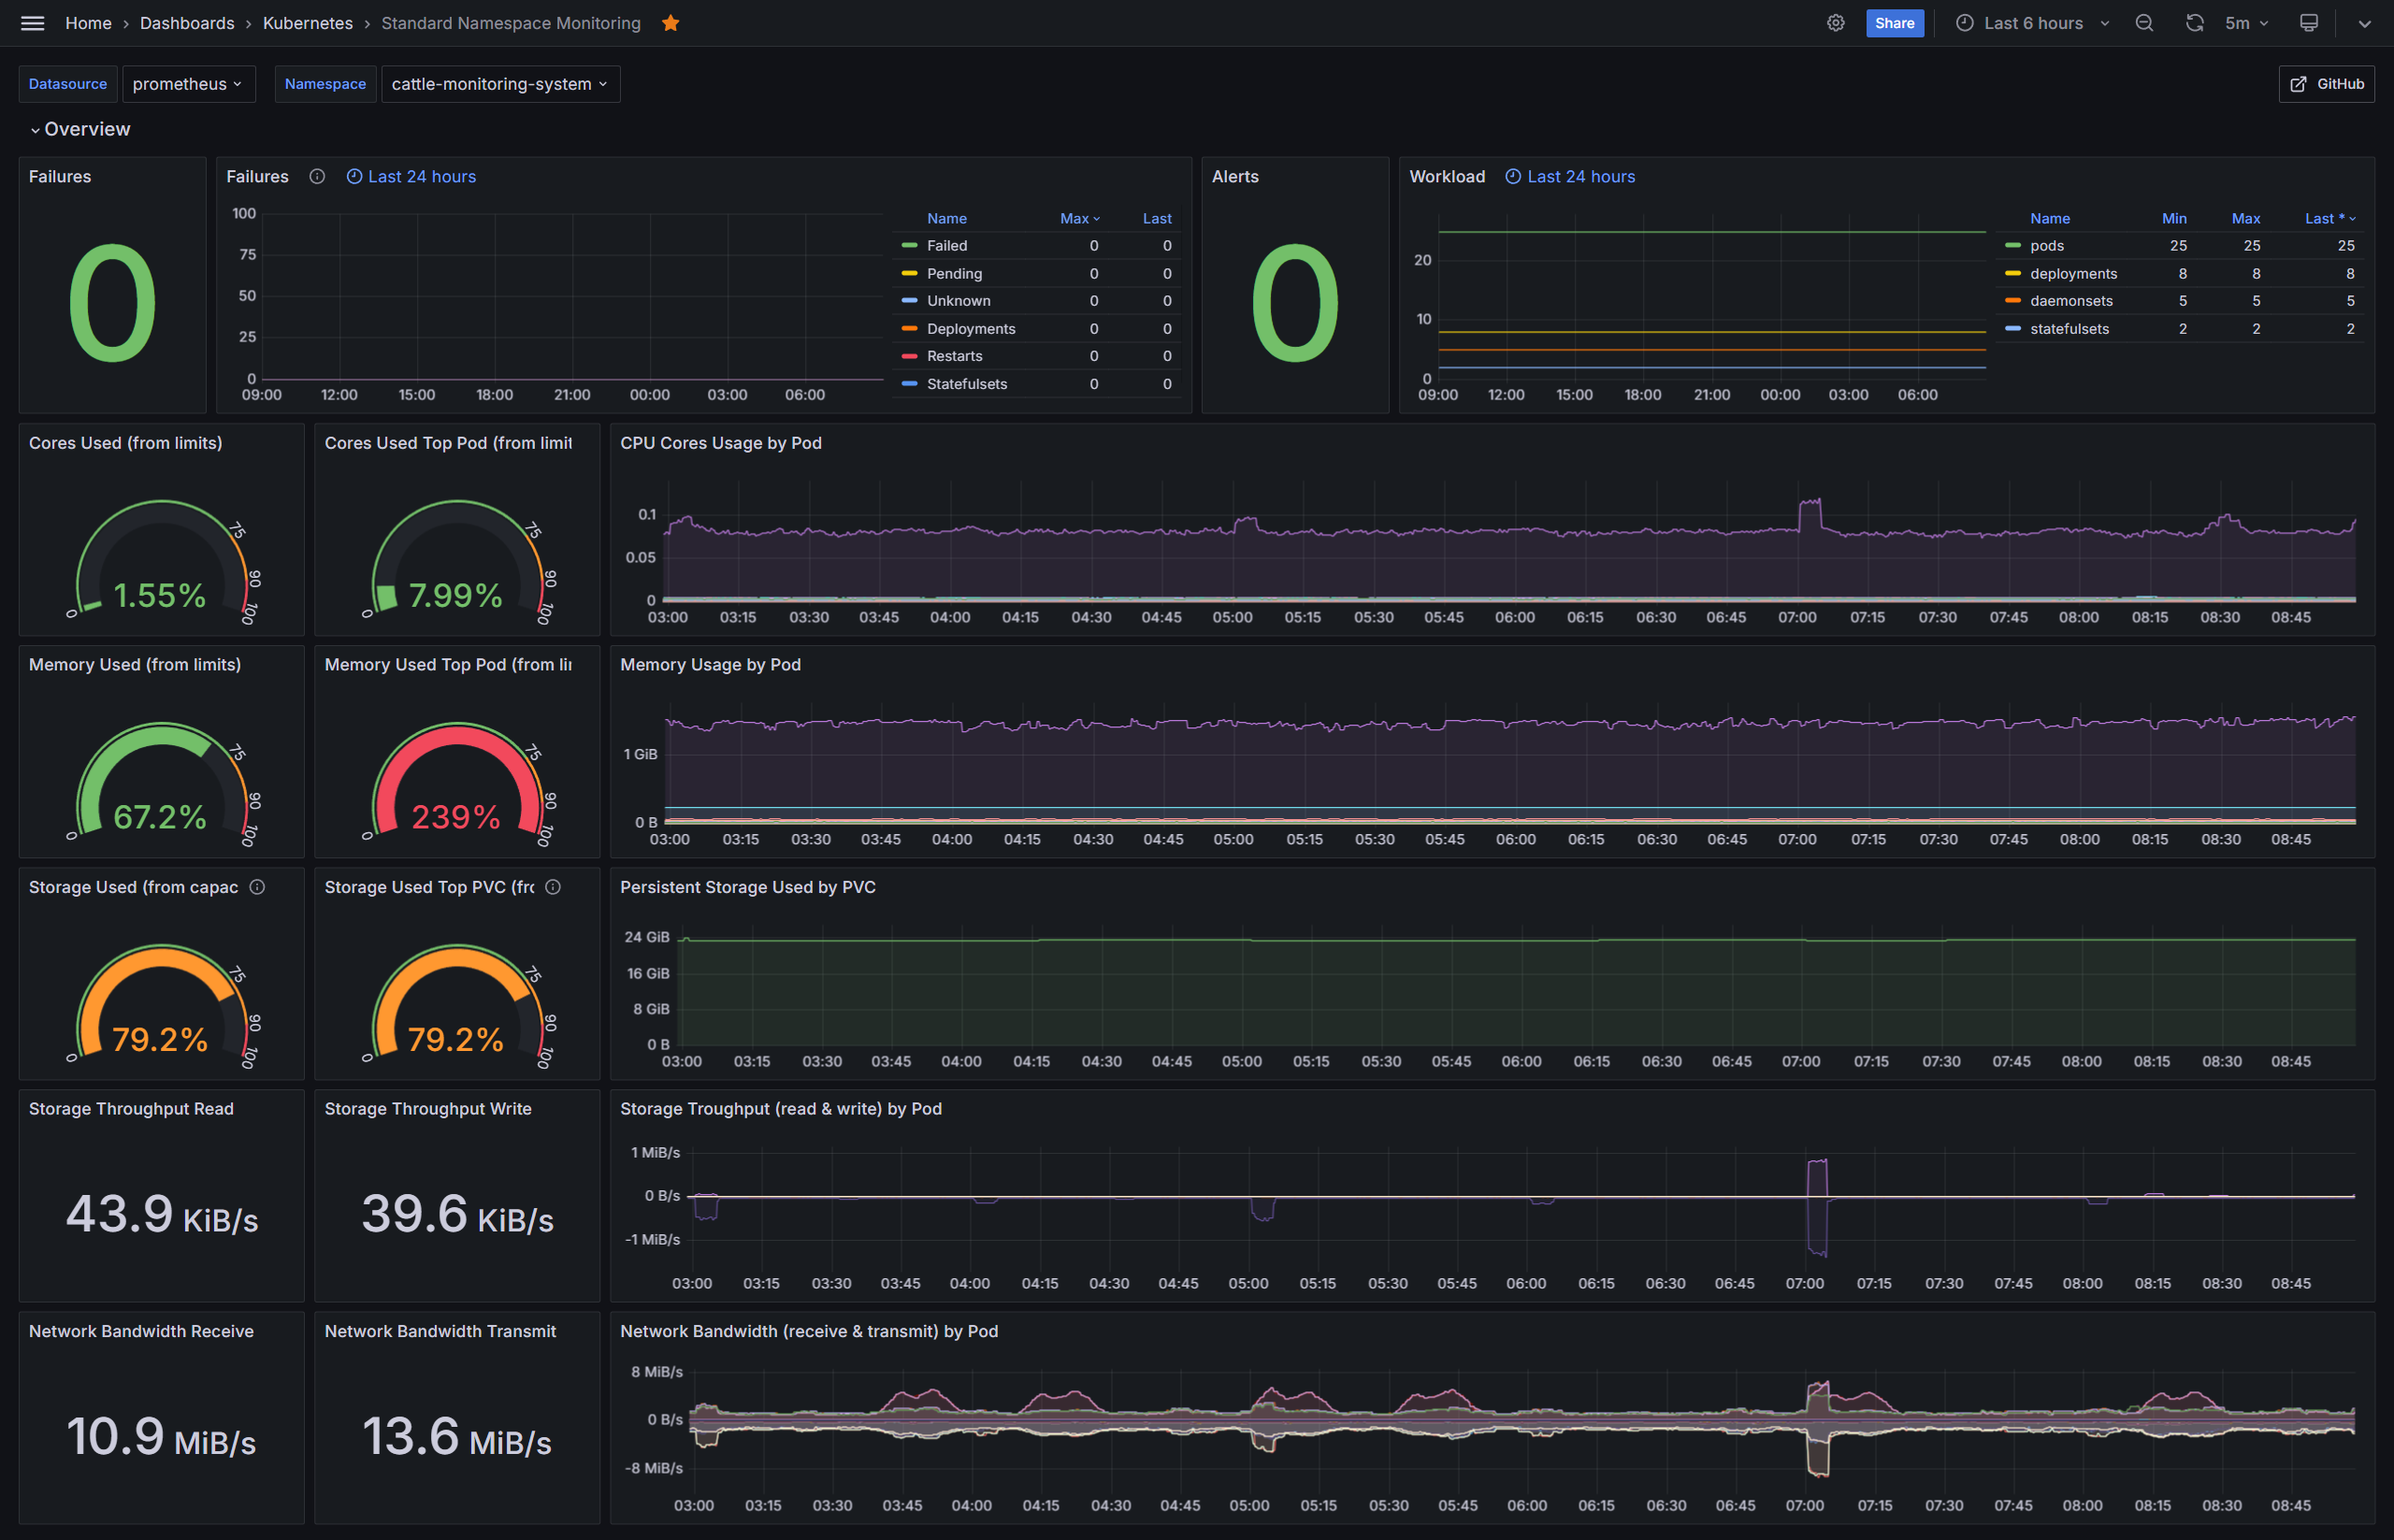
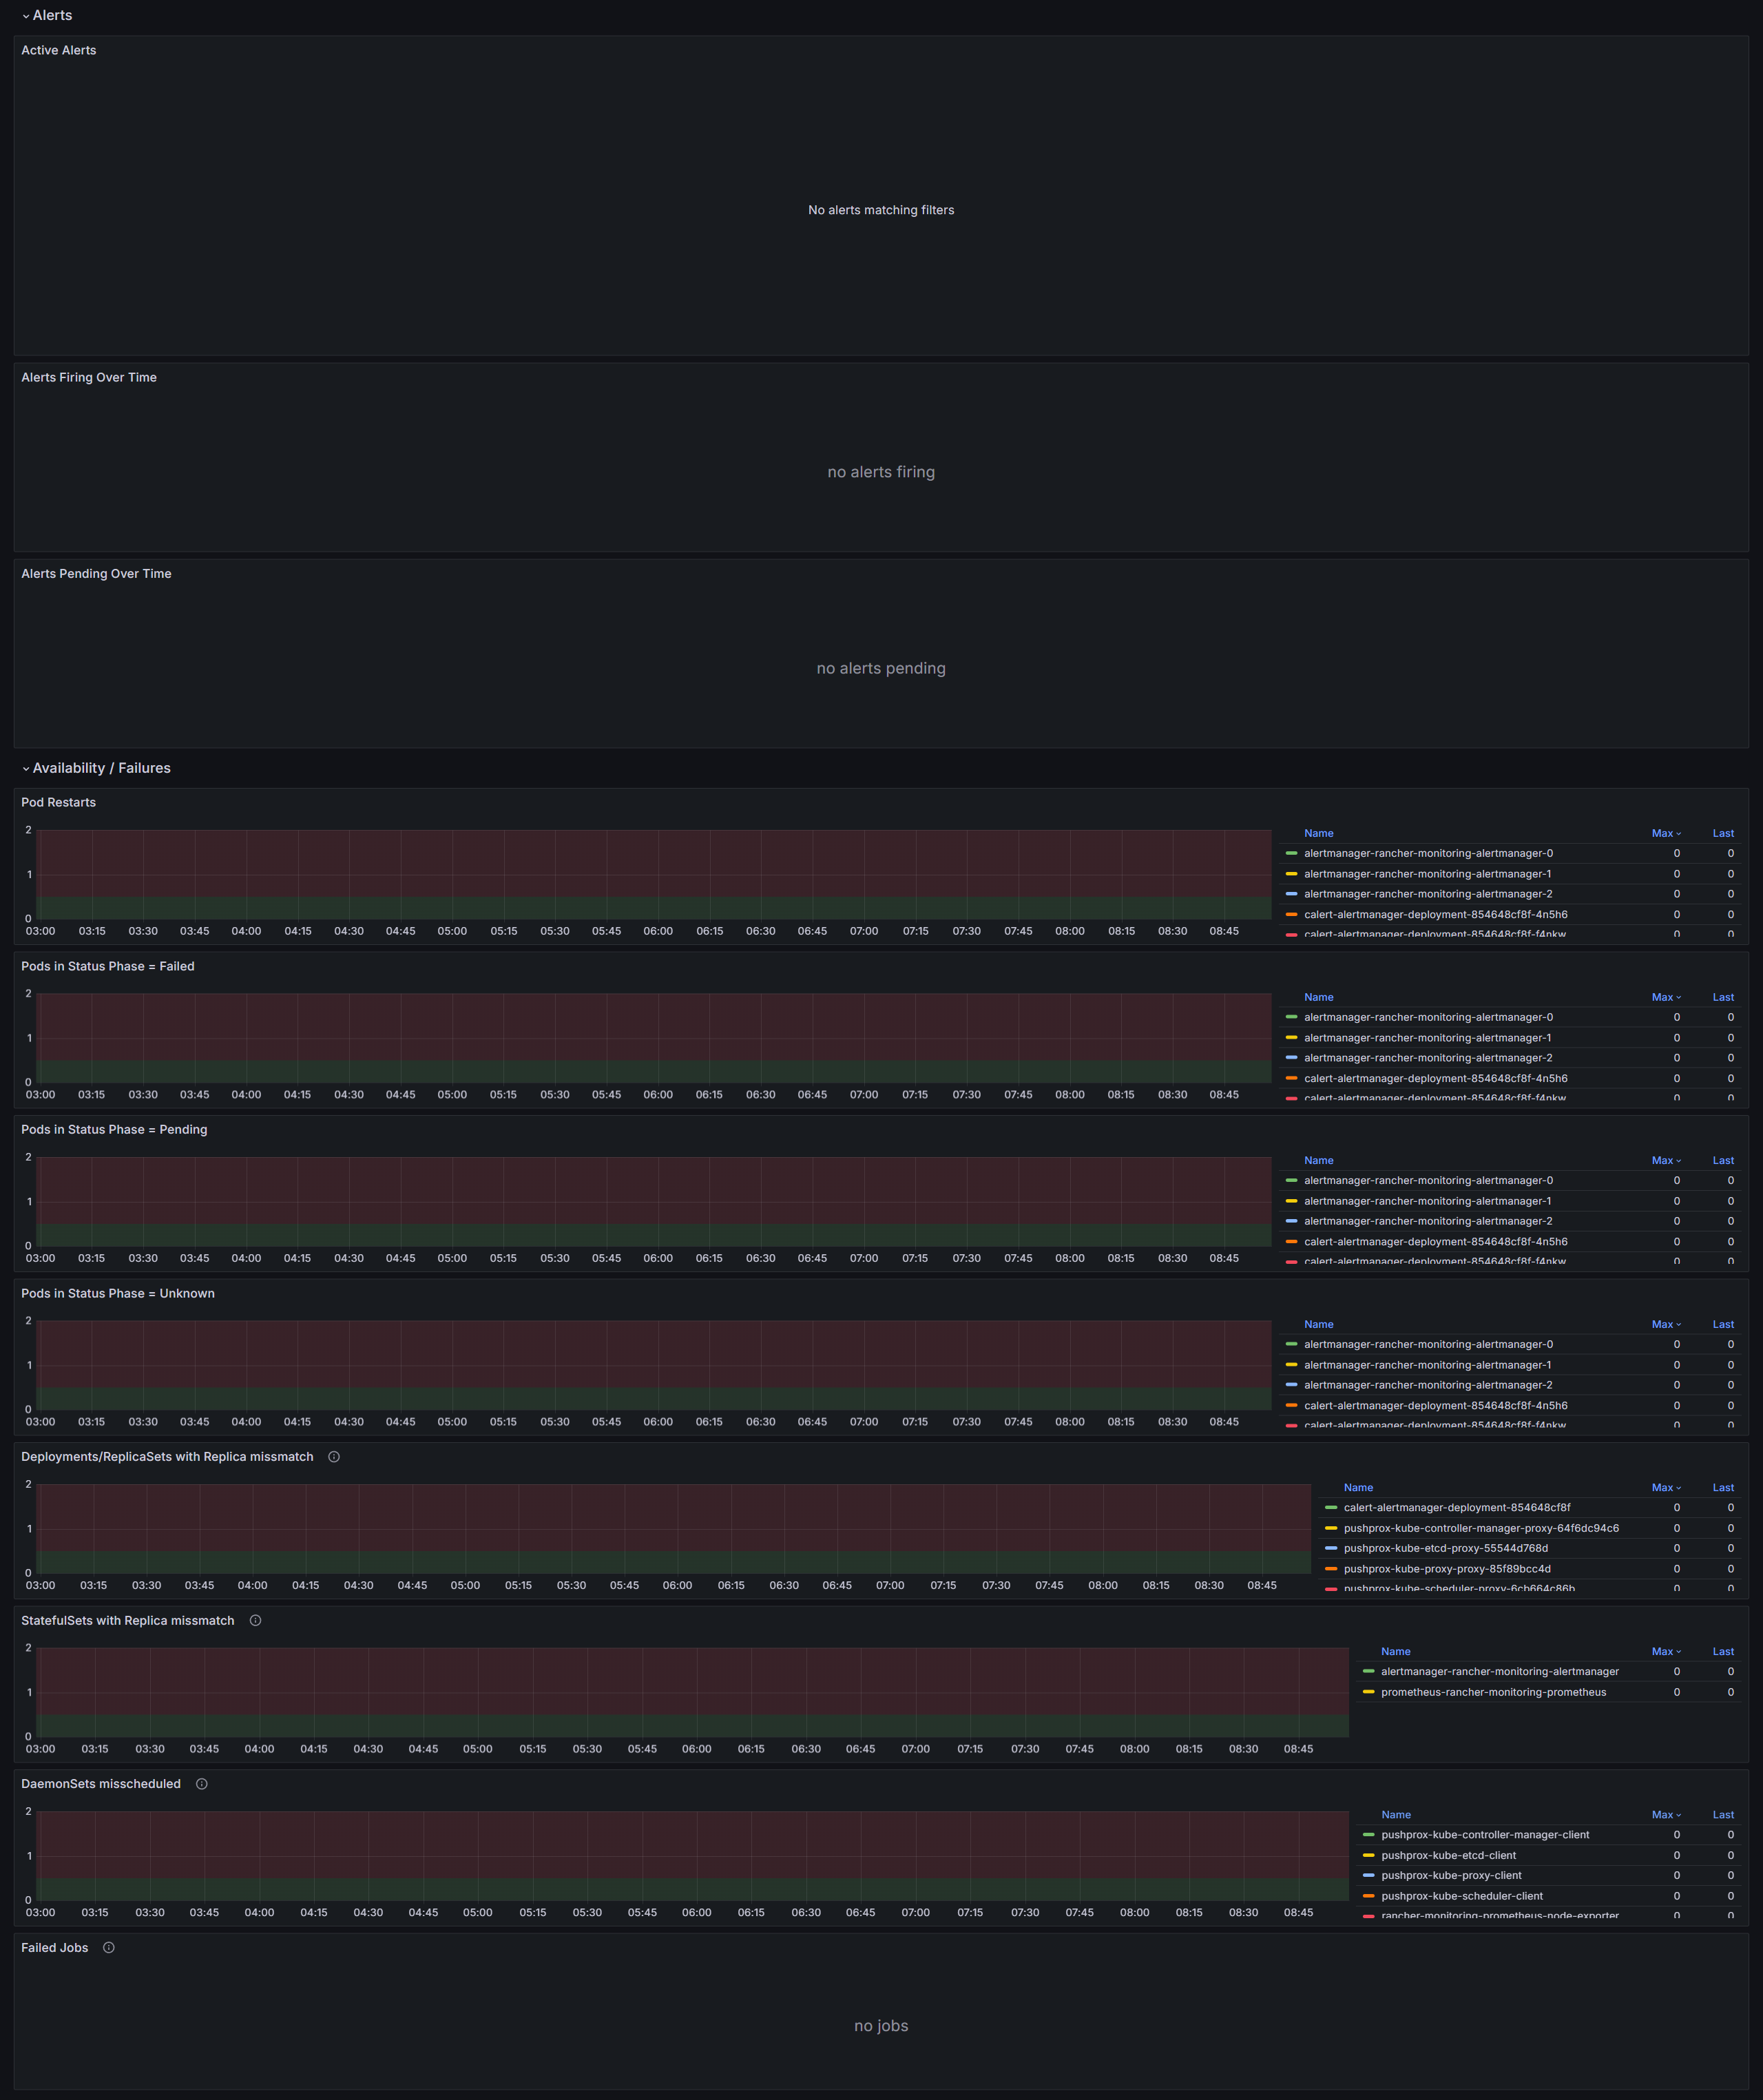
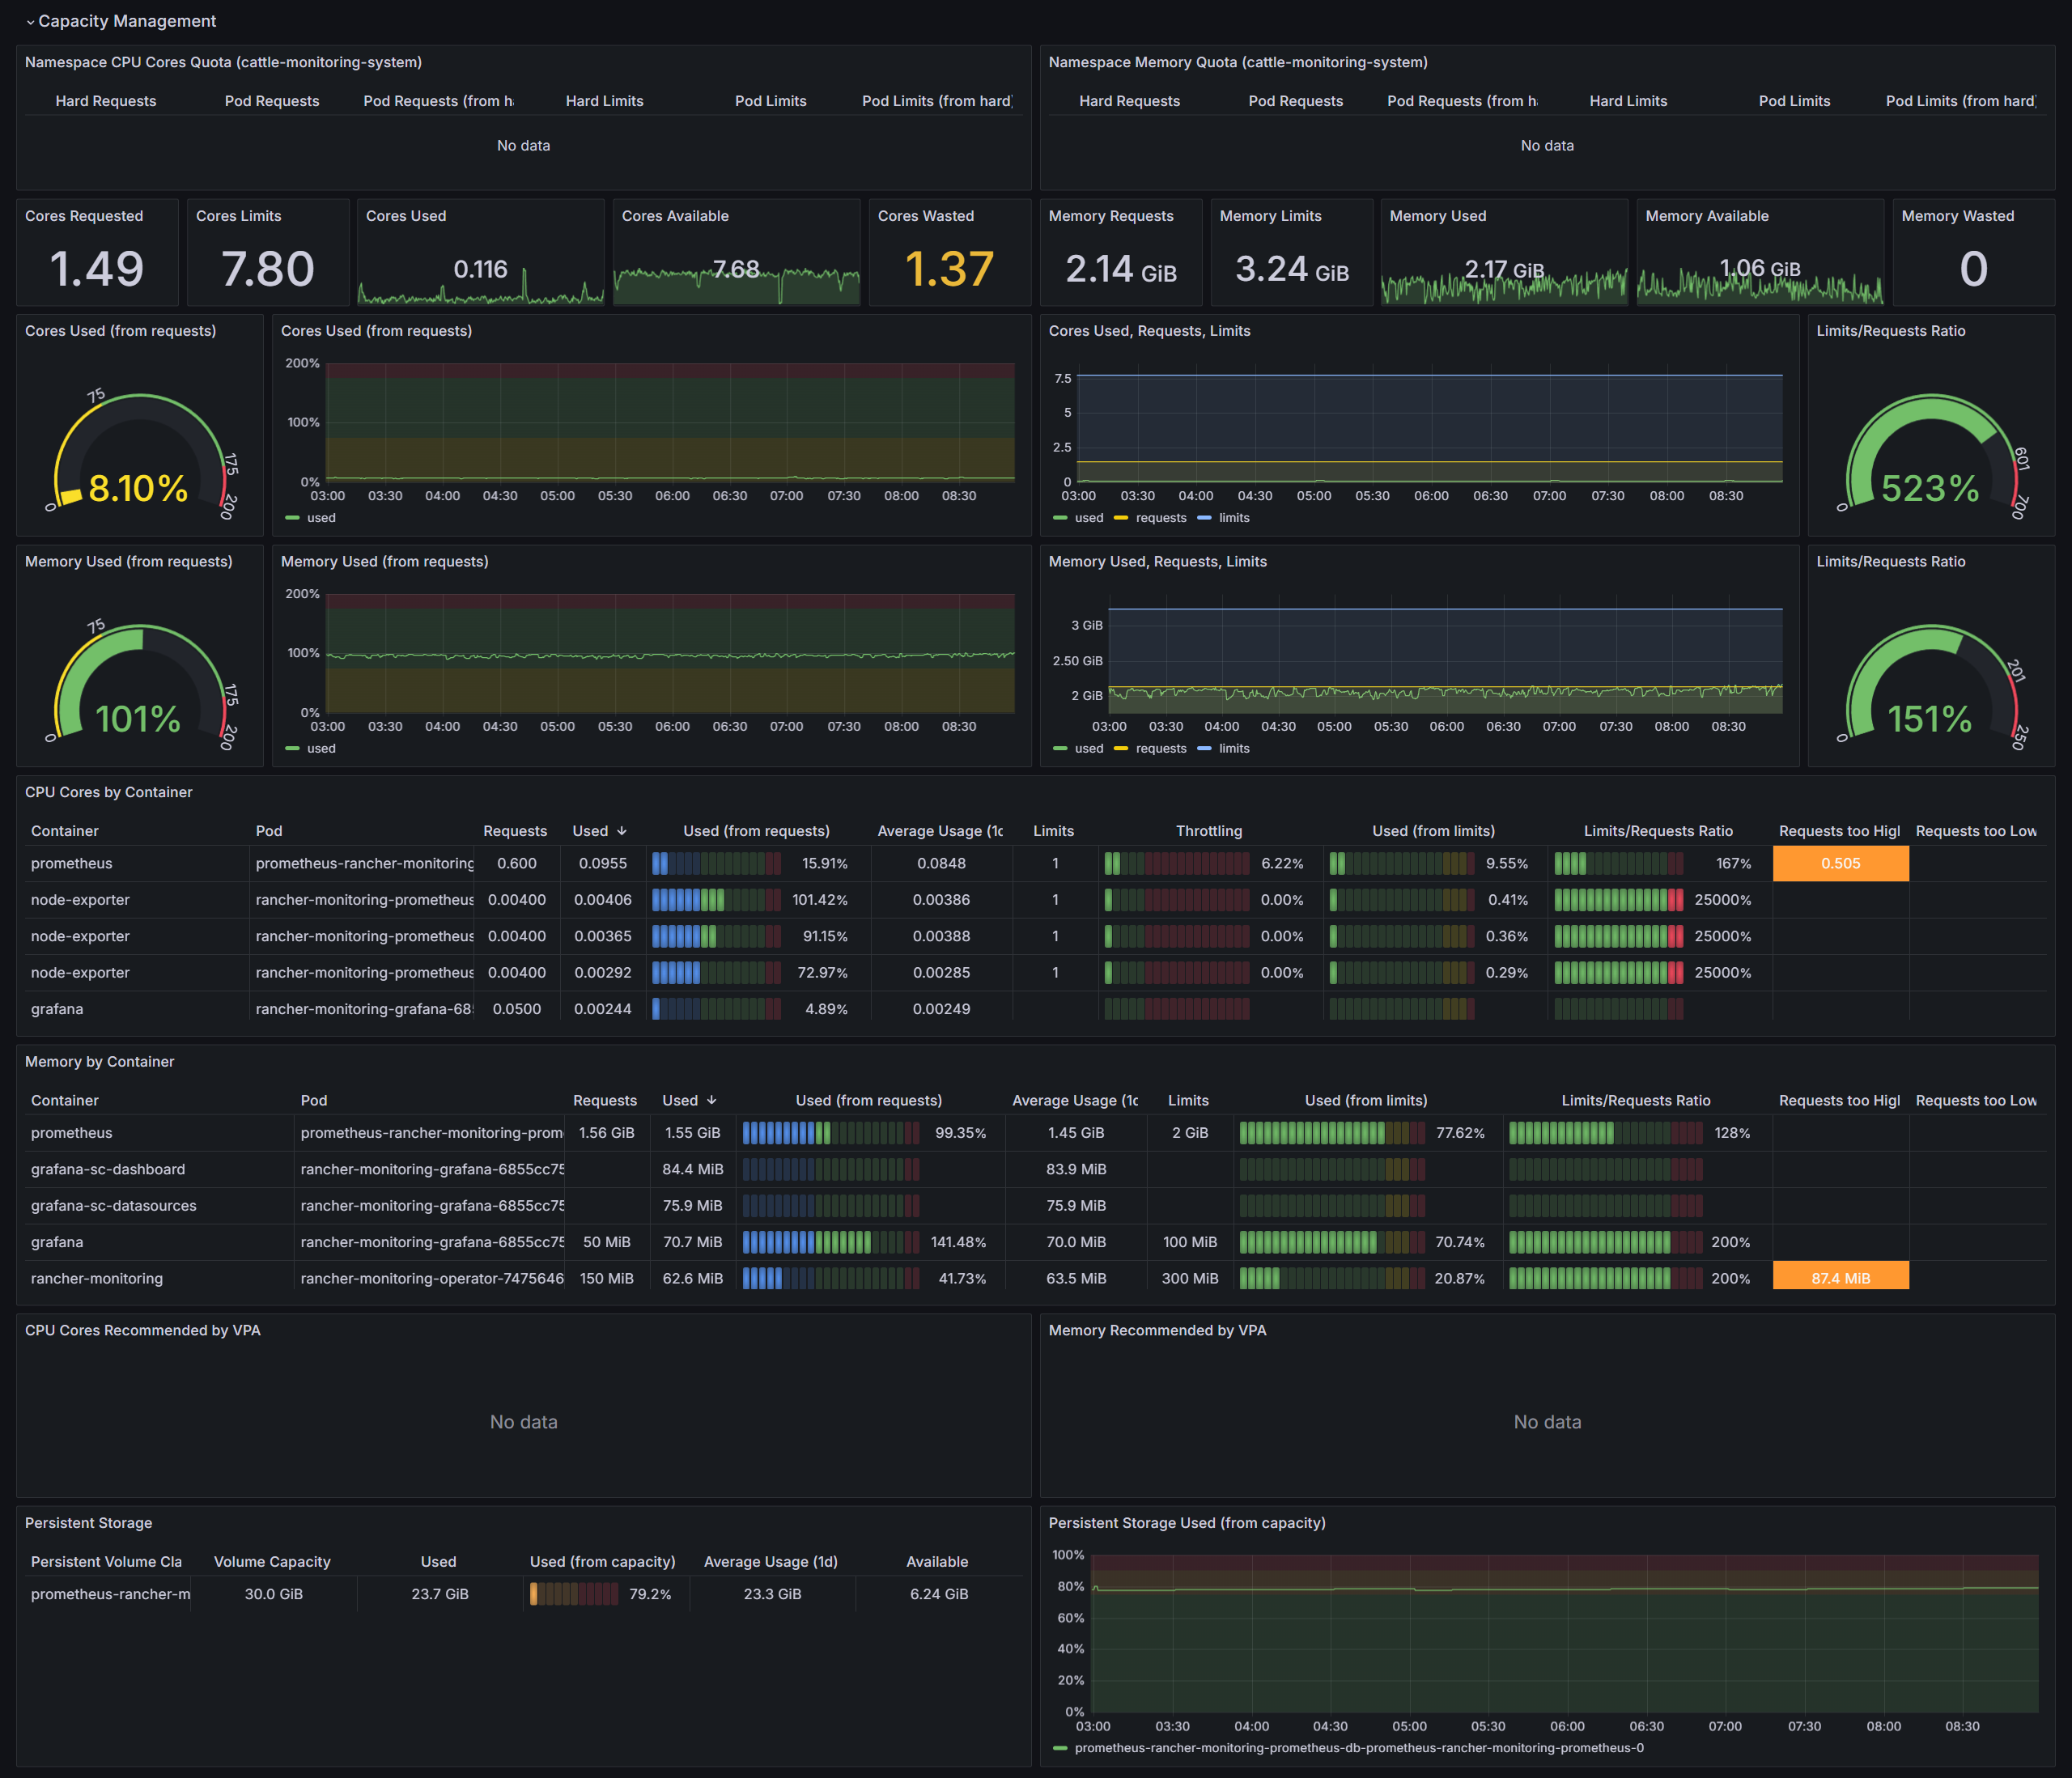
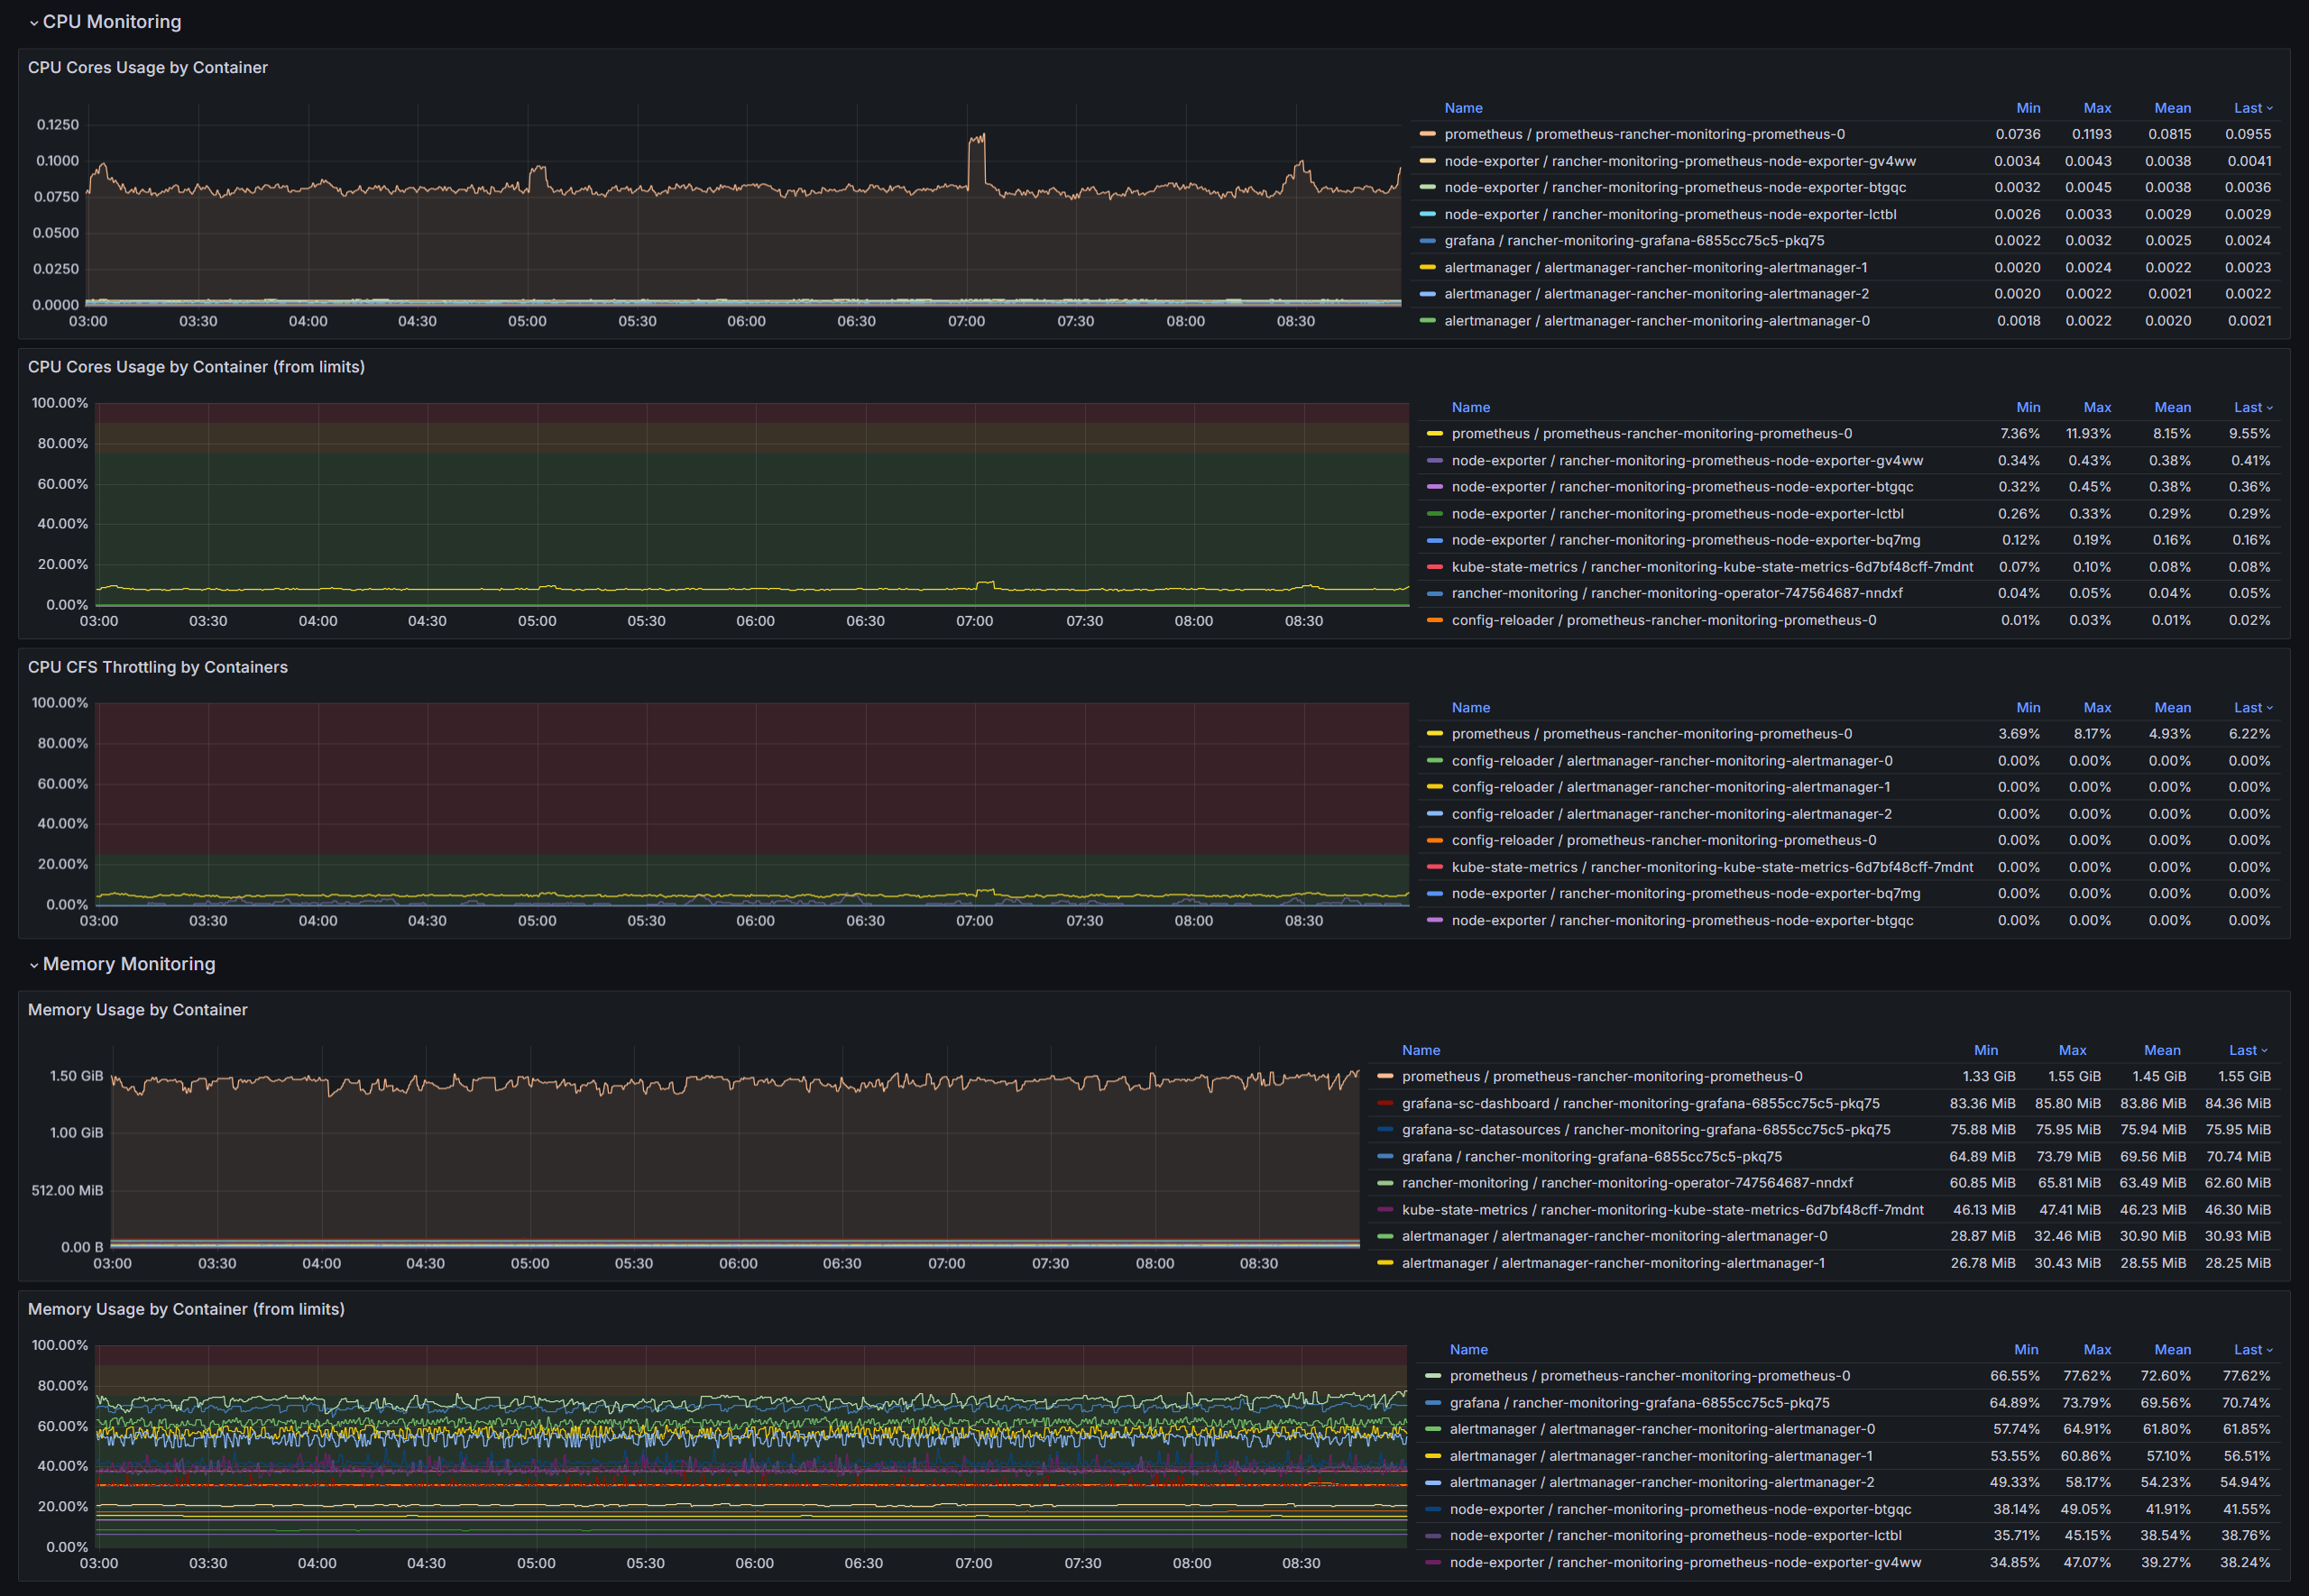
Standard Kubernetes/OpenShift namespace monitoring dashboard (needs Prometheus recording rules)
Screenshots
Used Metrics 2525
ALERTS
container_cpu_usage_seconds_total:sum_rate
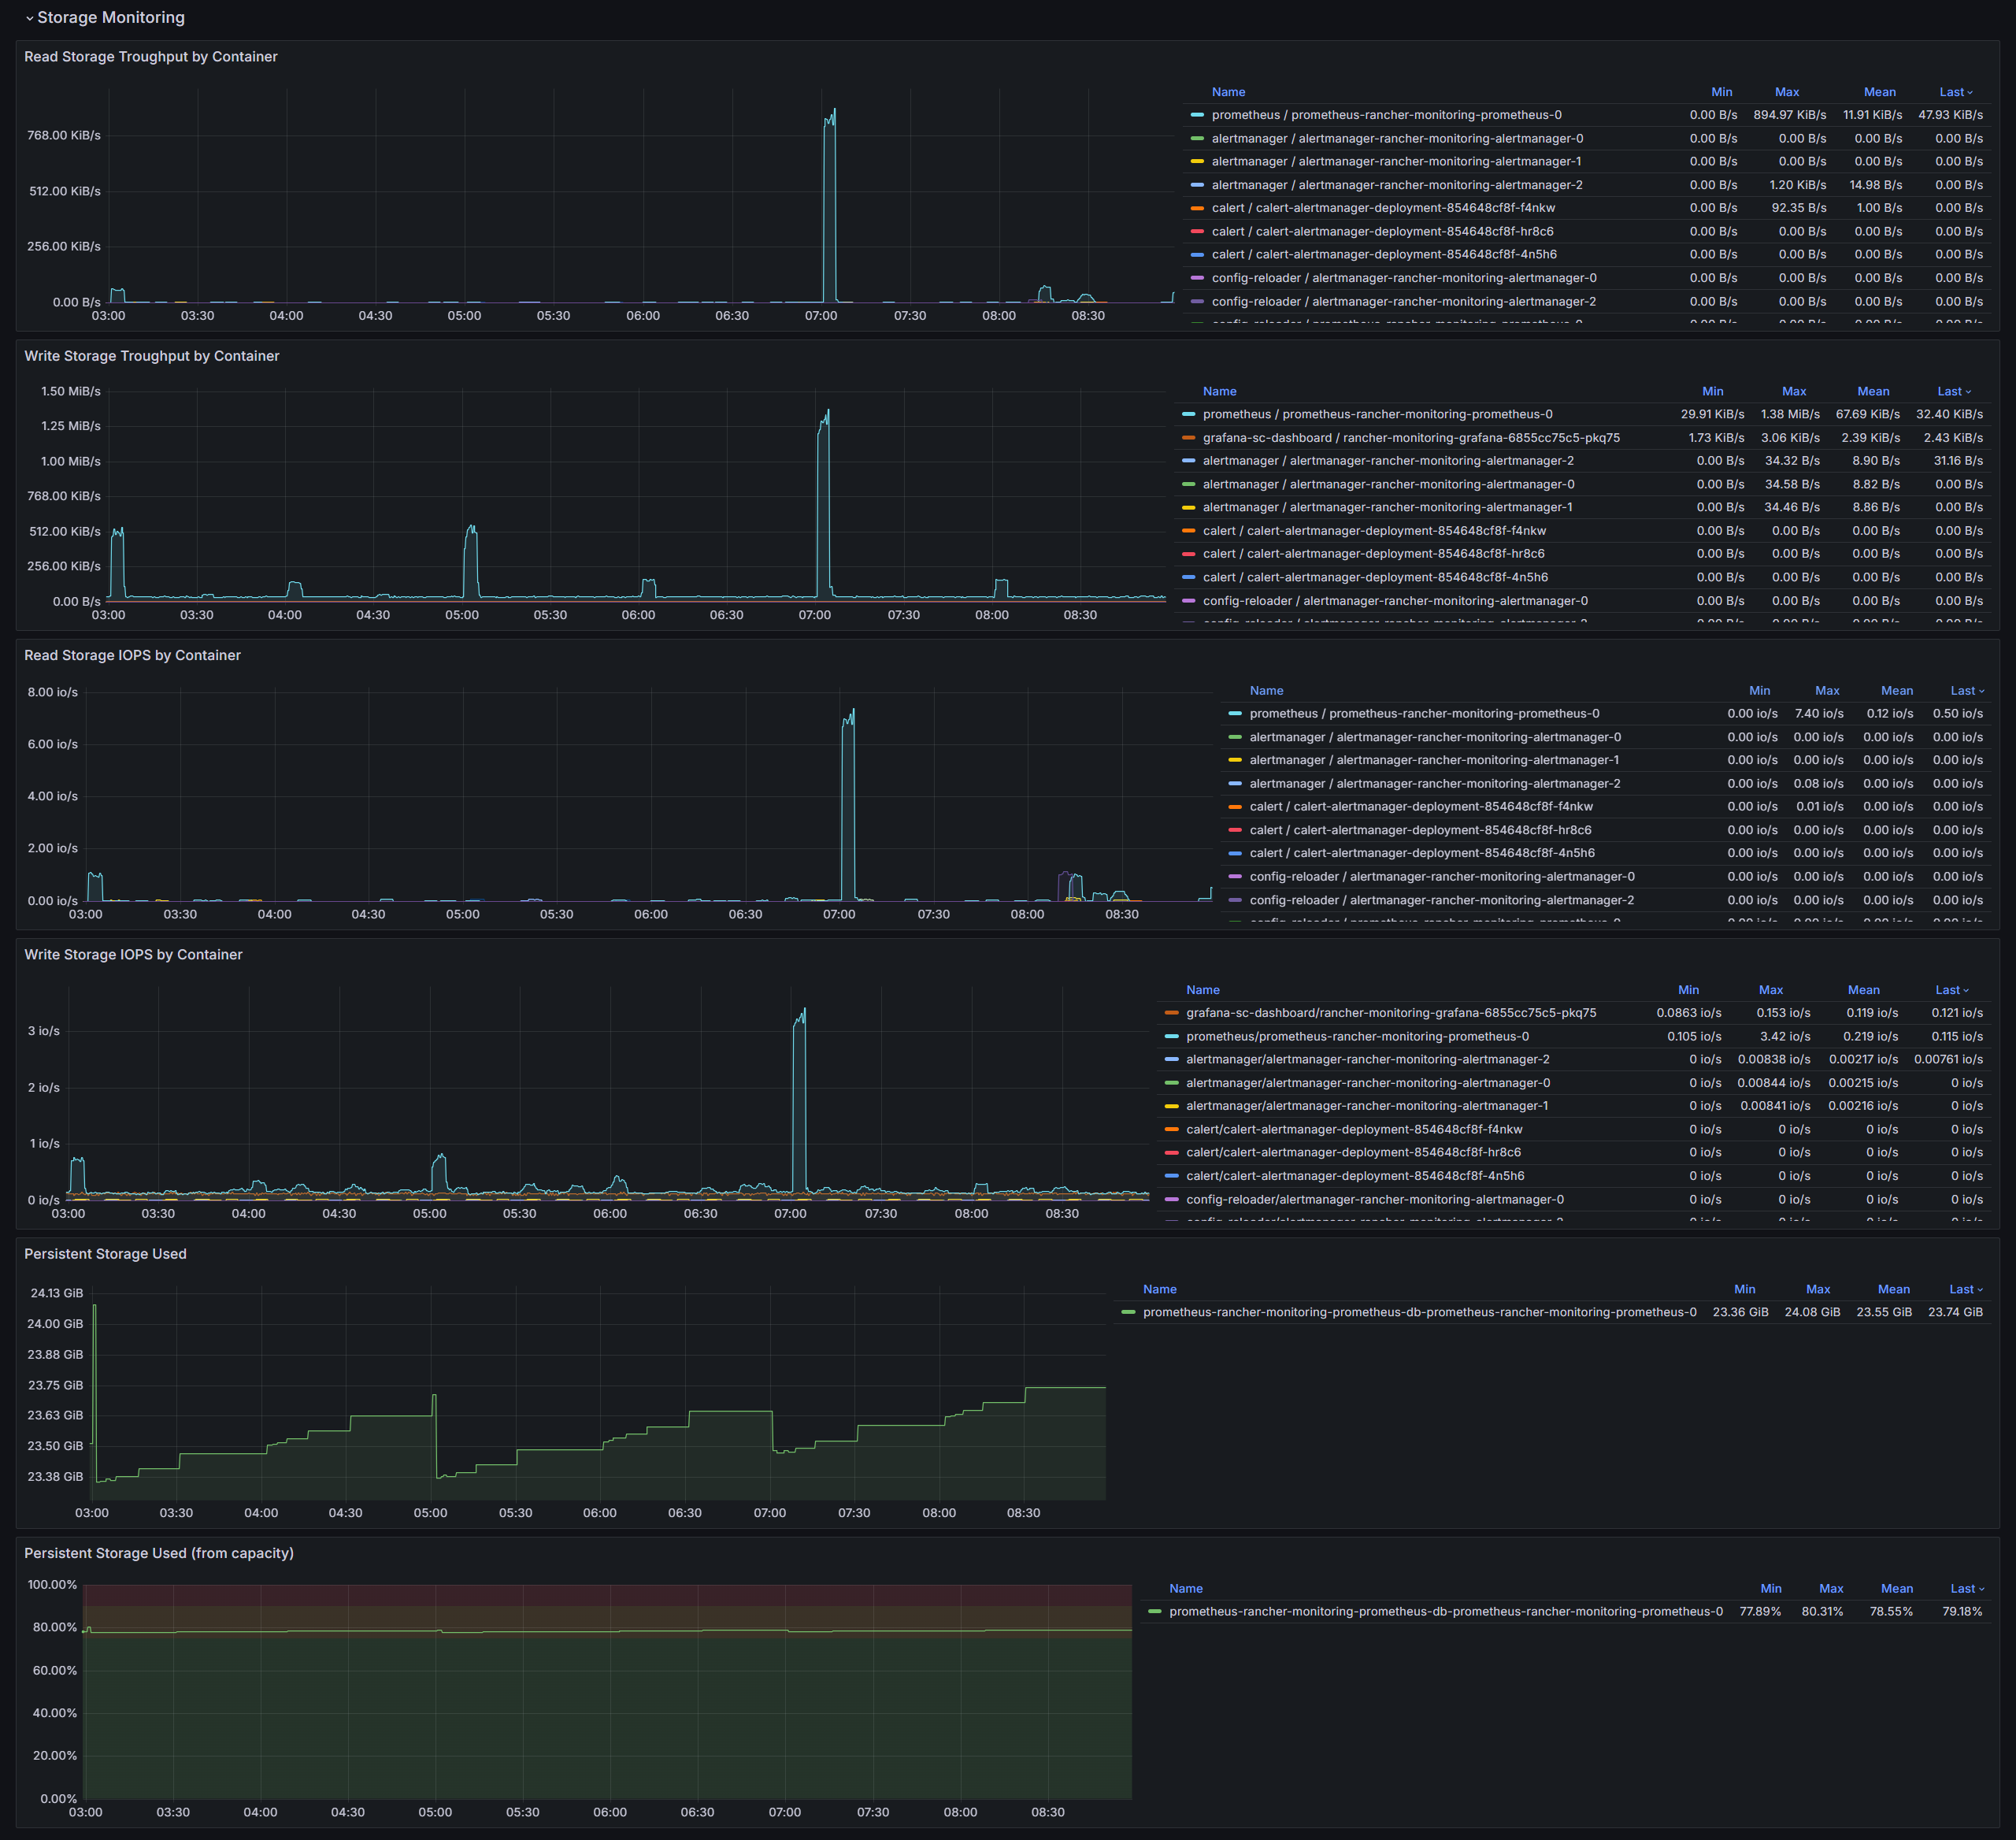
container_fs_reads_bytes_total:sum_rate
container_fs_writes_bytes_total:sum_rate
container_memory_working_set_bytes:sum
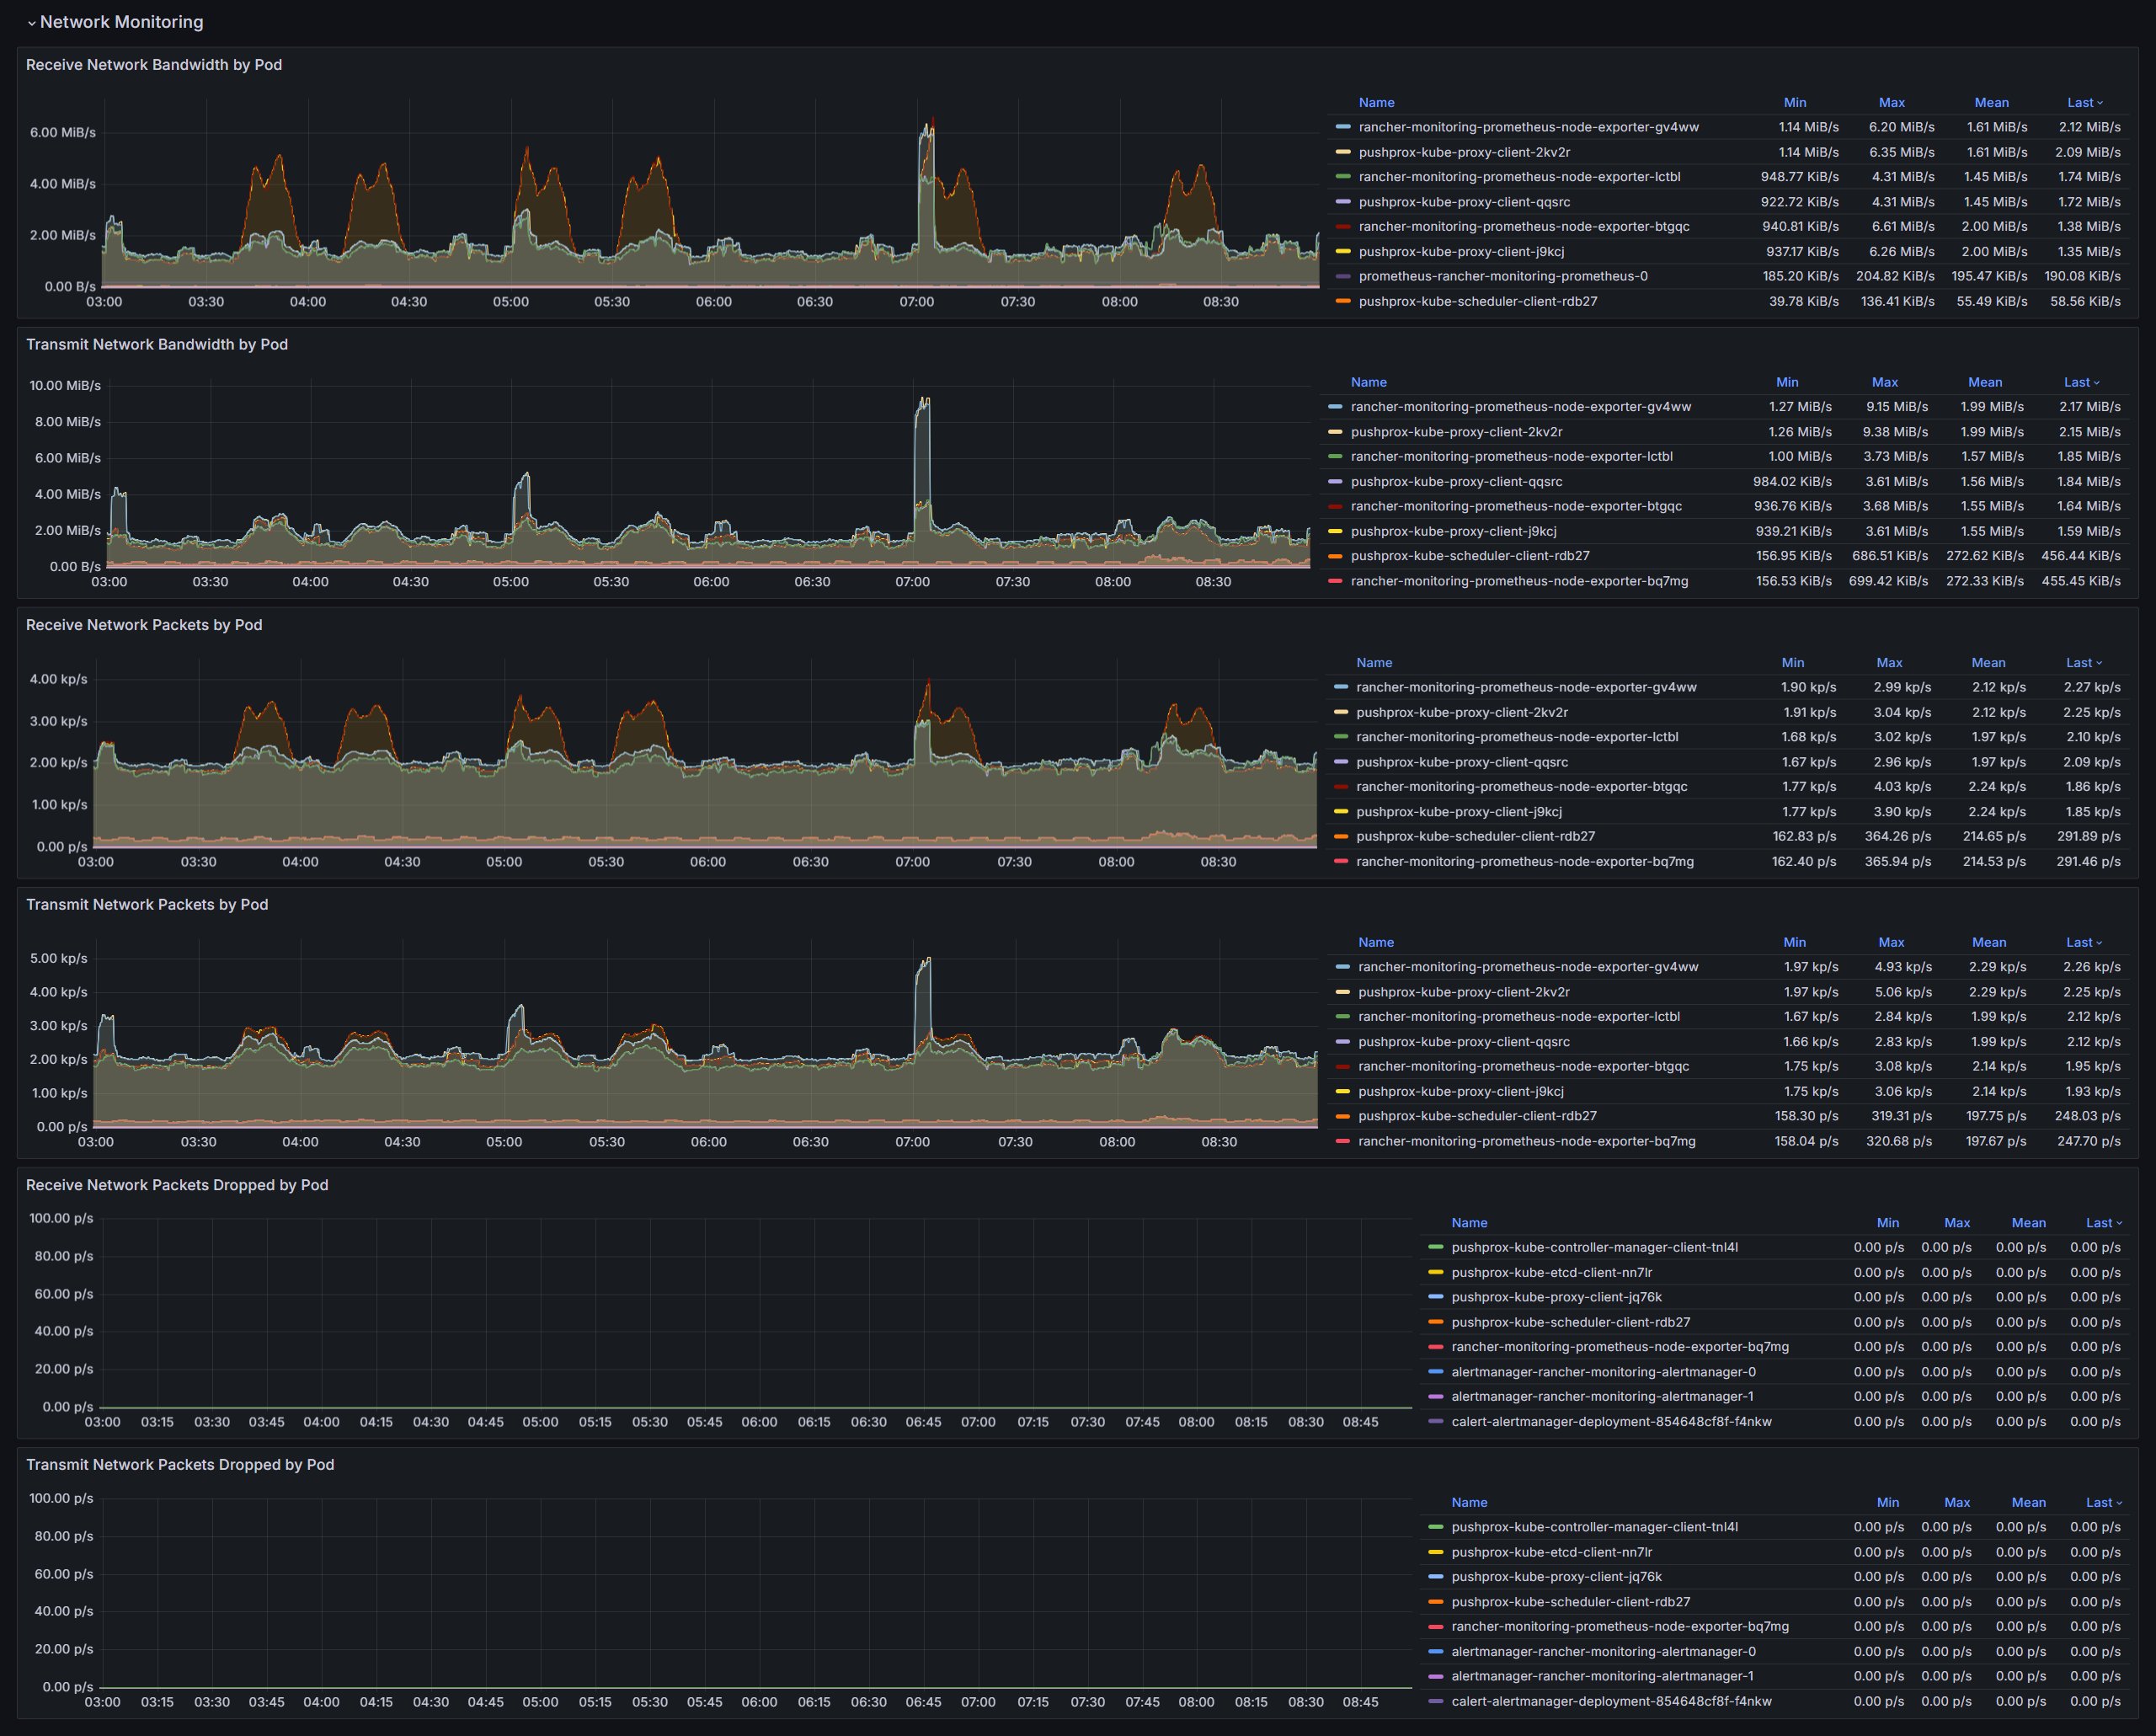
container_network_receive_bytes_total:sum_rate
container_network_transmit_bytes_total:sum_rate
group
kube_cronjob_info
kube_daemonset_metadata_generation
kube_daemonset_status_number_misscheduled
kube_deployment_spec_replicas
kube_job_status_failed
kube_pod_container_resource_limits:cpu:running
kube_pod_container_resource_limits:memory:running
kube_pod_info
kube_pod_status_phase
kube_pod_status_ready
kube_replicaset_spec_replicas
kube_replicaset_status_ready_replicas
kube_statefulset_replicas
kube_statefulset_status_replicas_ready
kubelet_volume_stats_capacity_bytes
kubelet_volume_stats_used_bytes
topk