Standard Cluster Monitoring 6,7636,763 5.0 (1 reviews)
11/14/2022
10/6/2025
10
>=12.0.2
Prometheus
Description
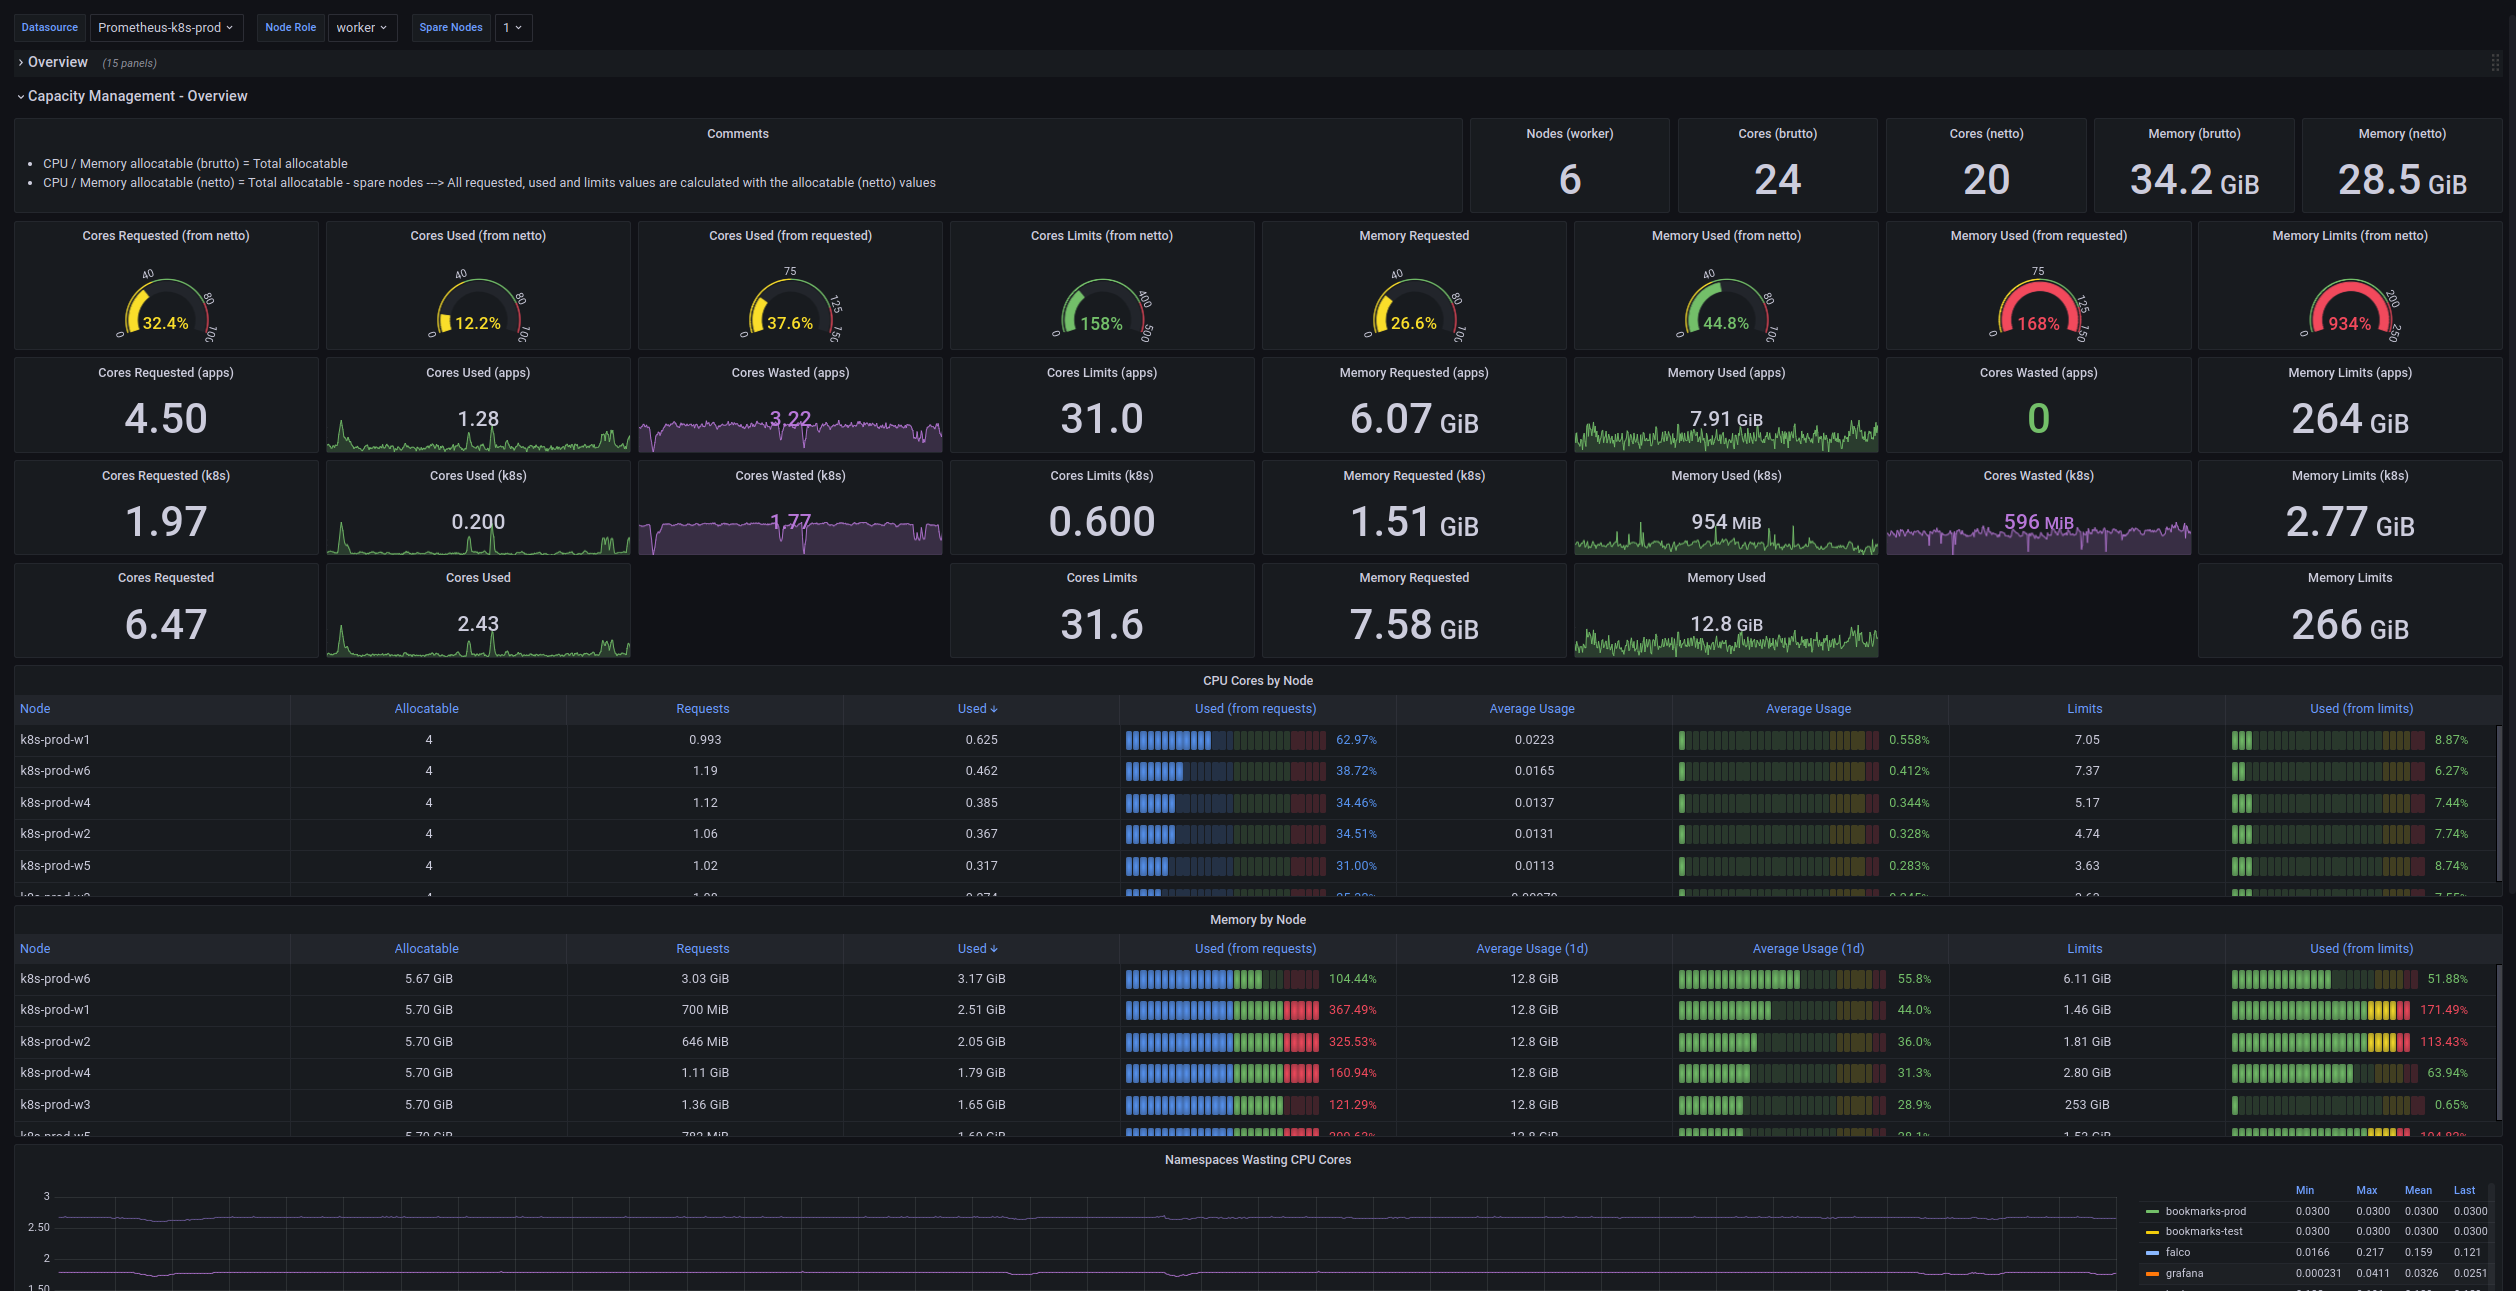
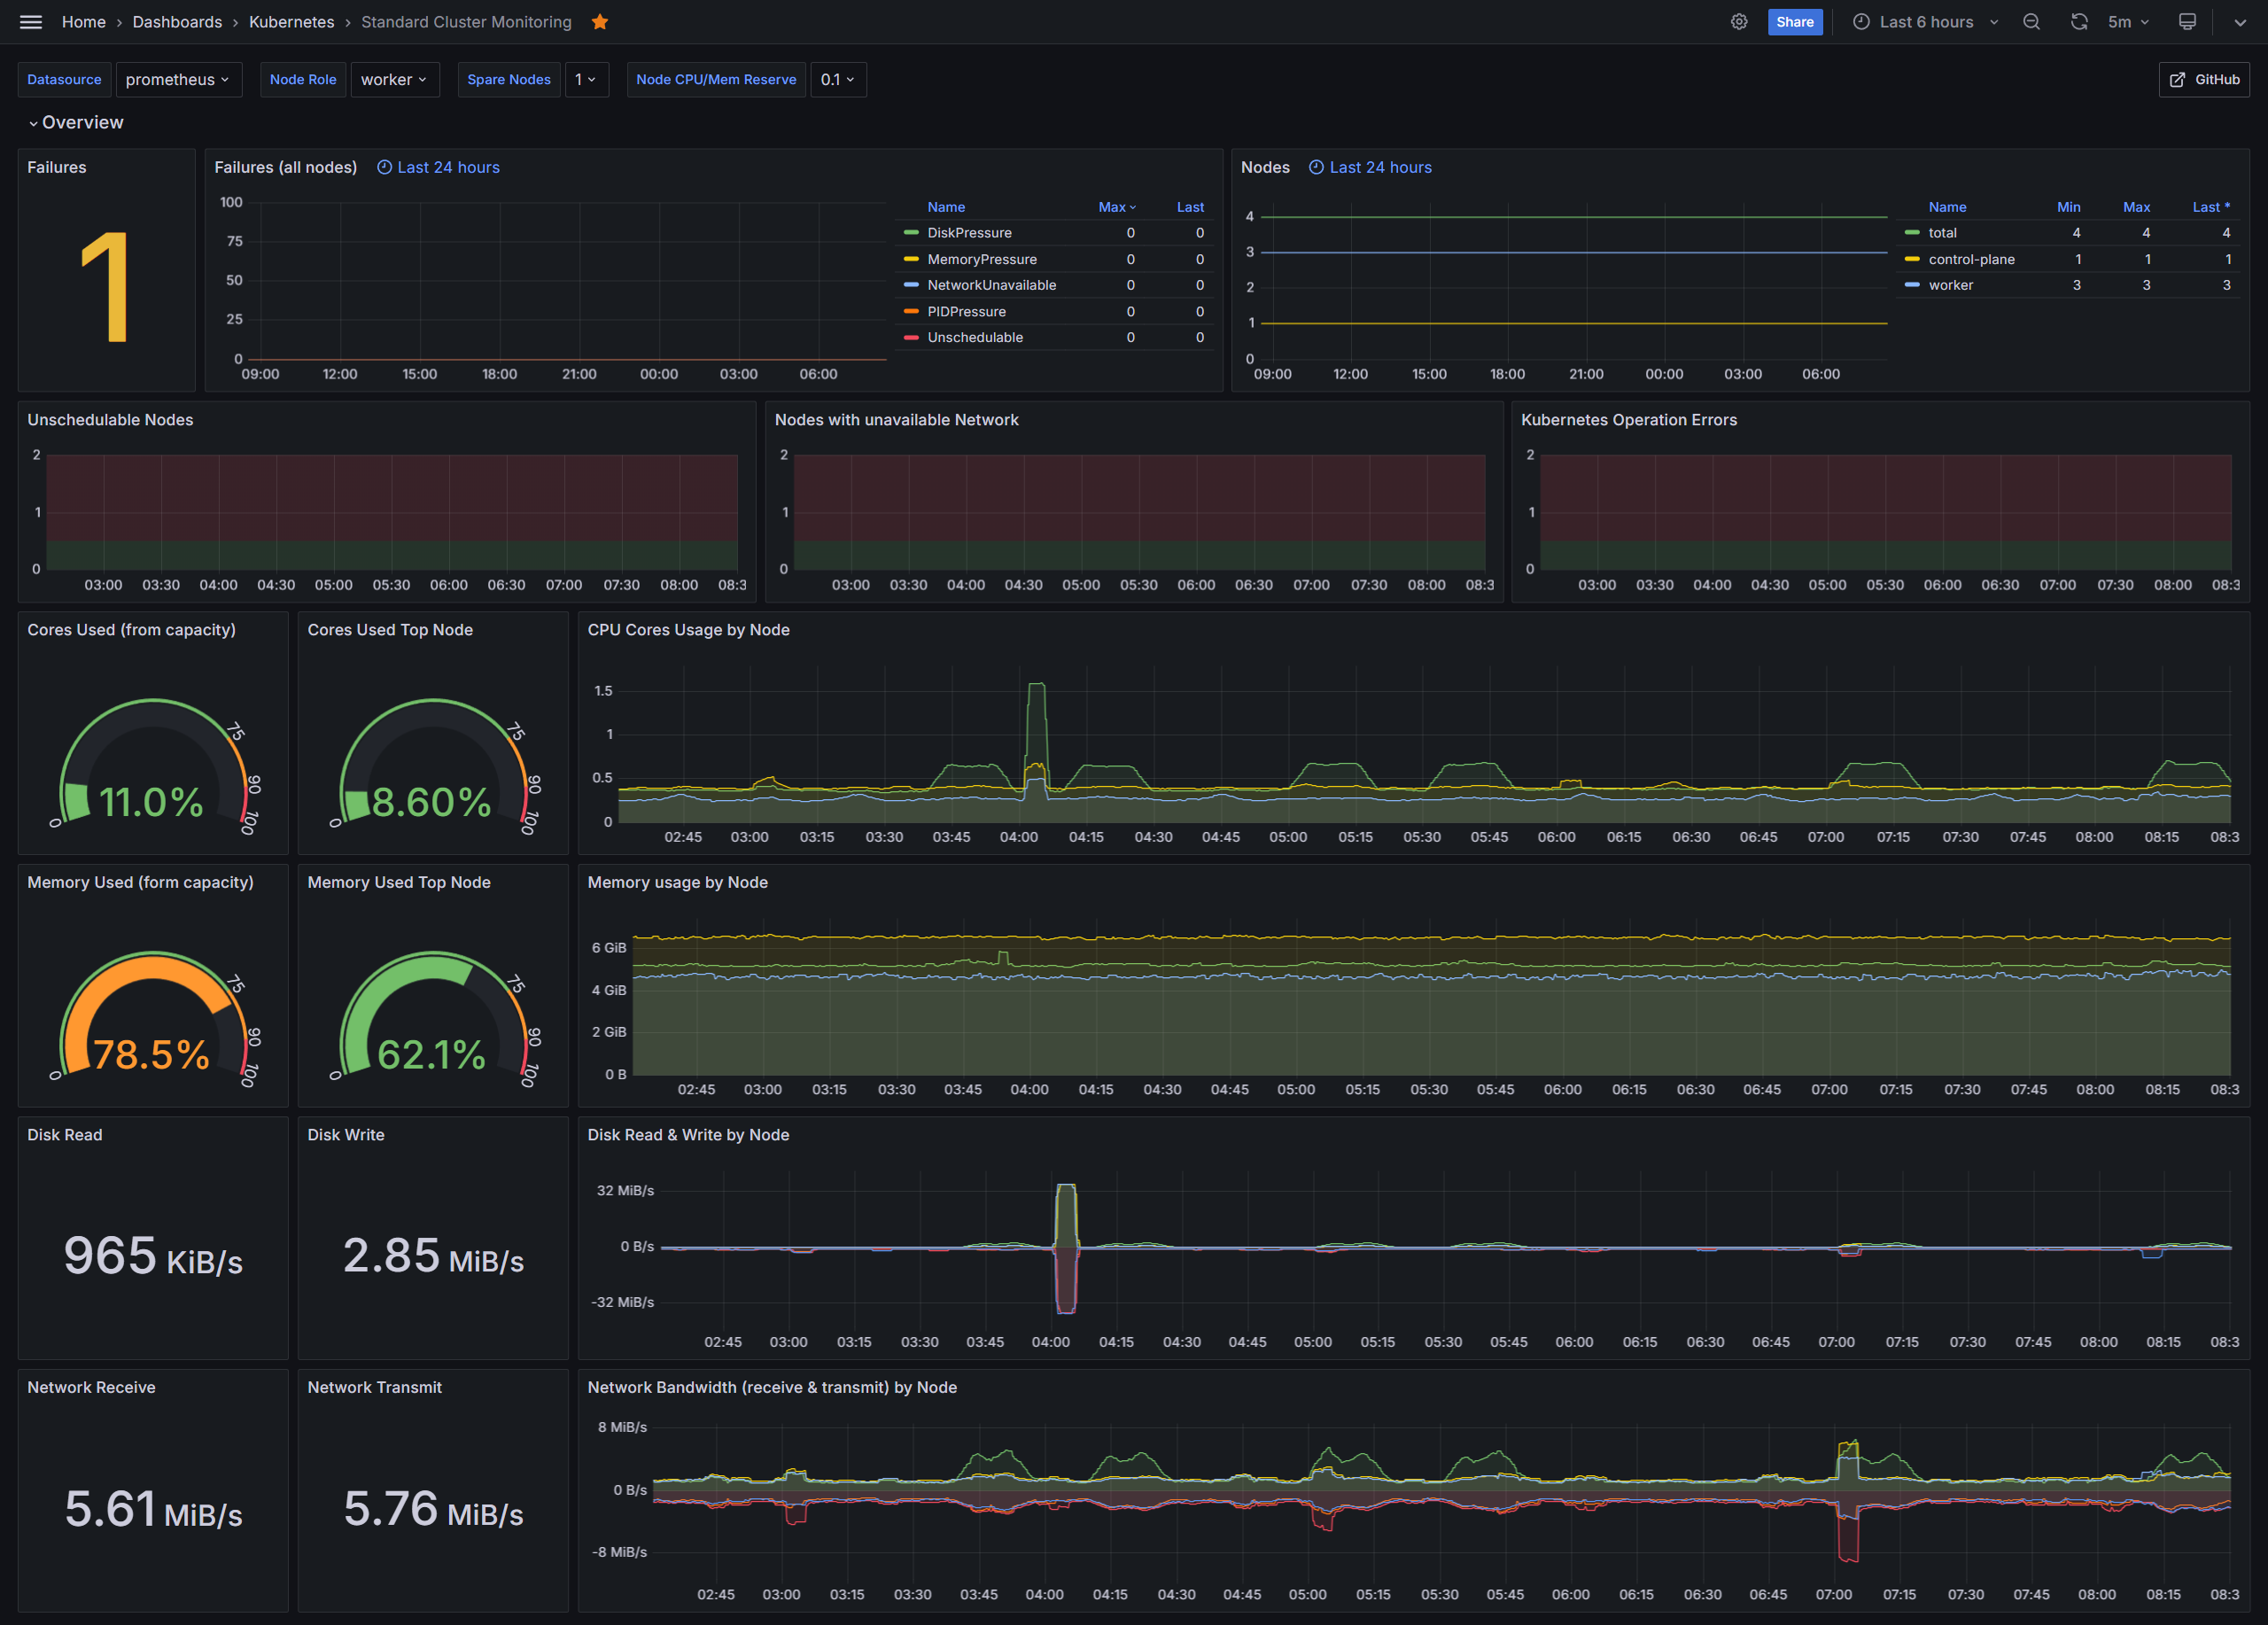
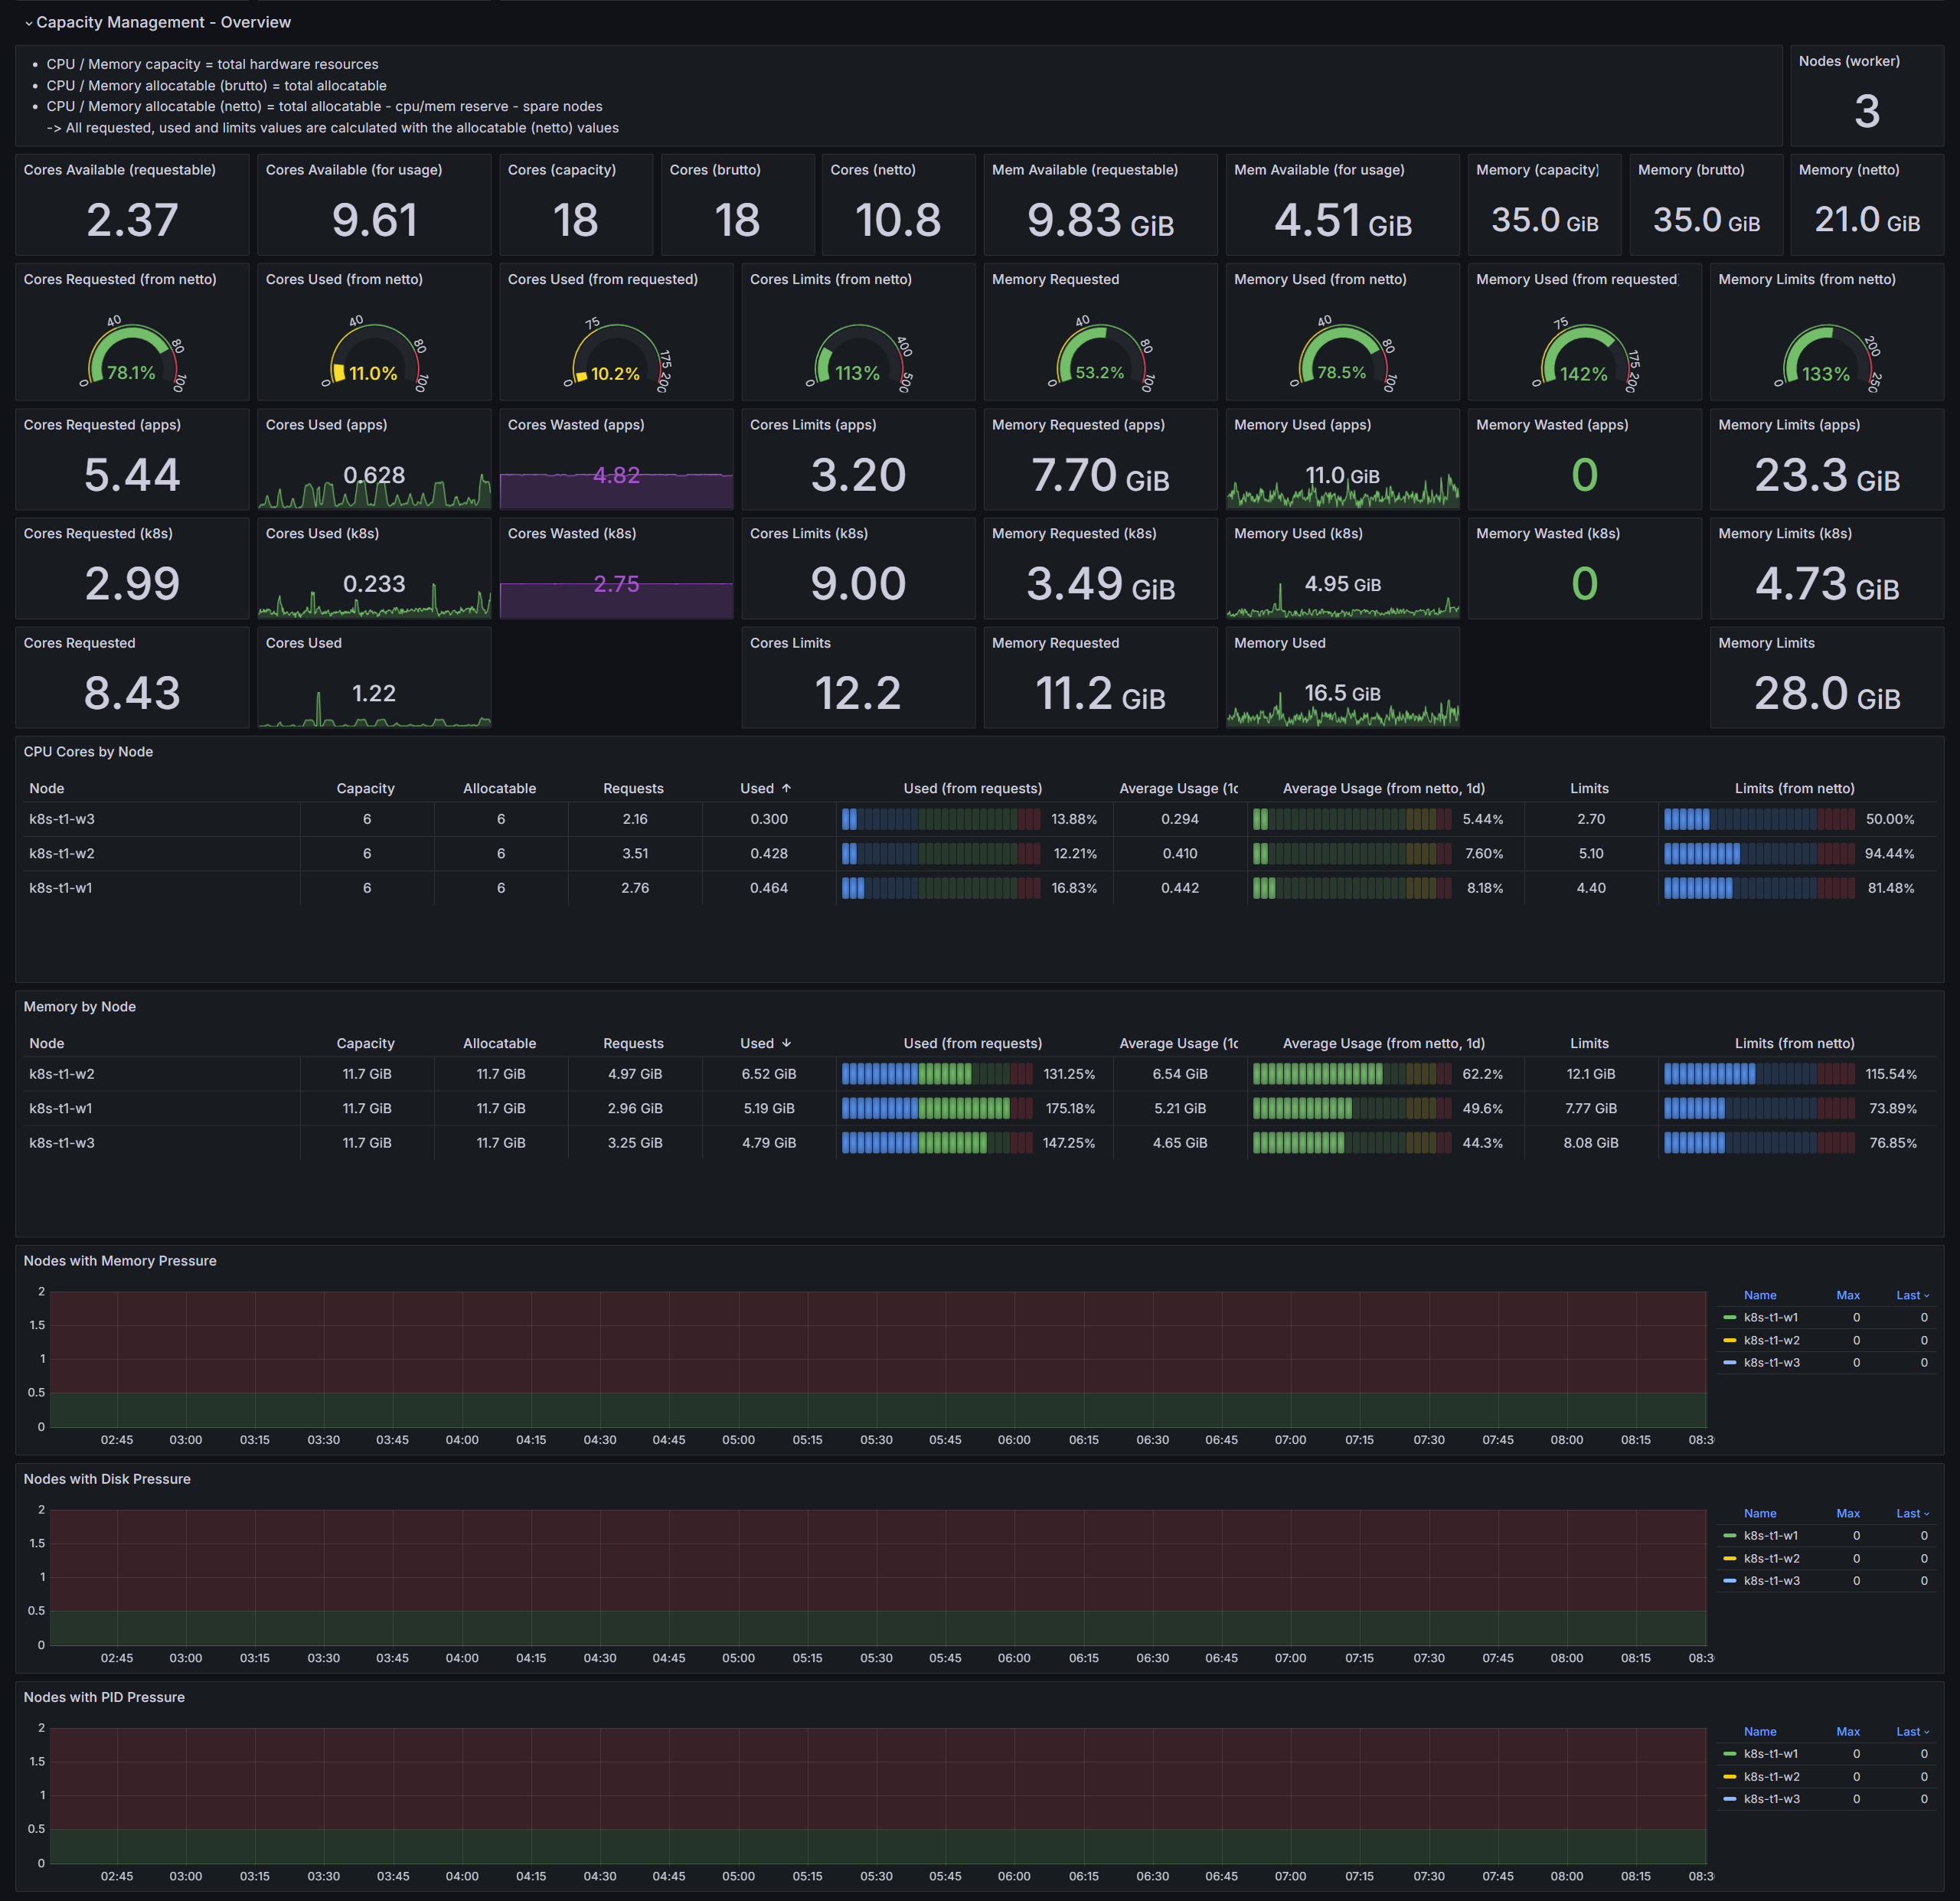
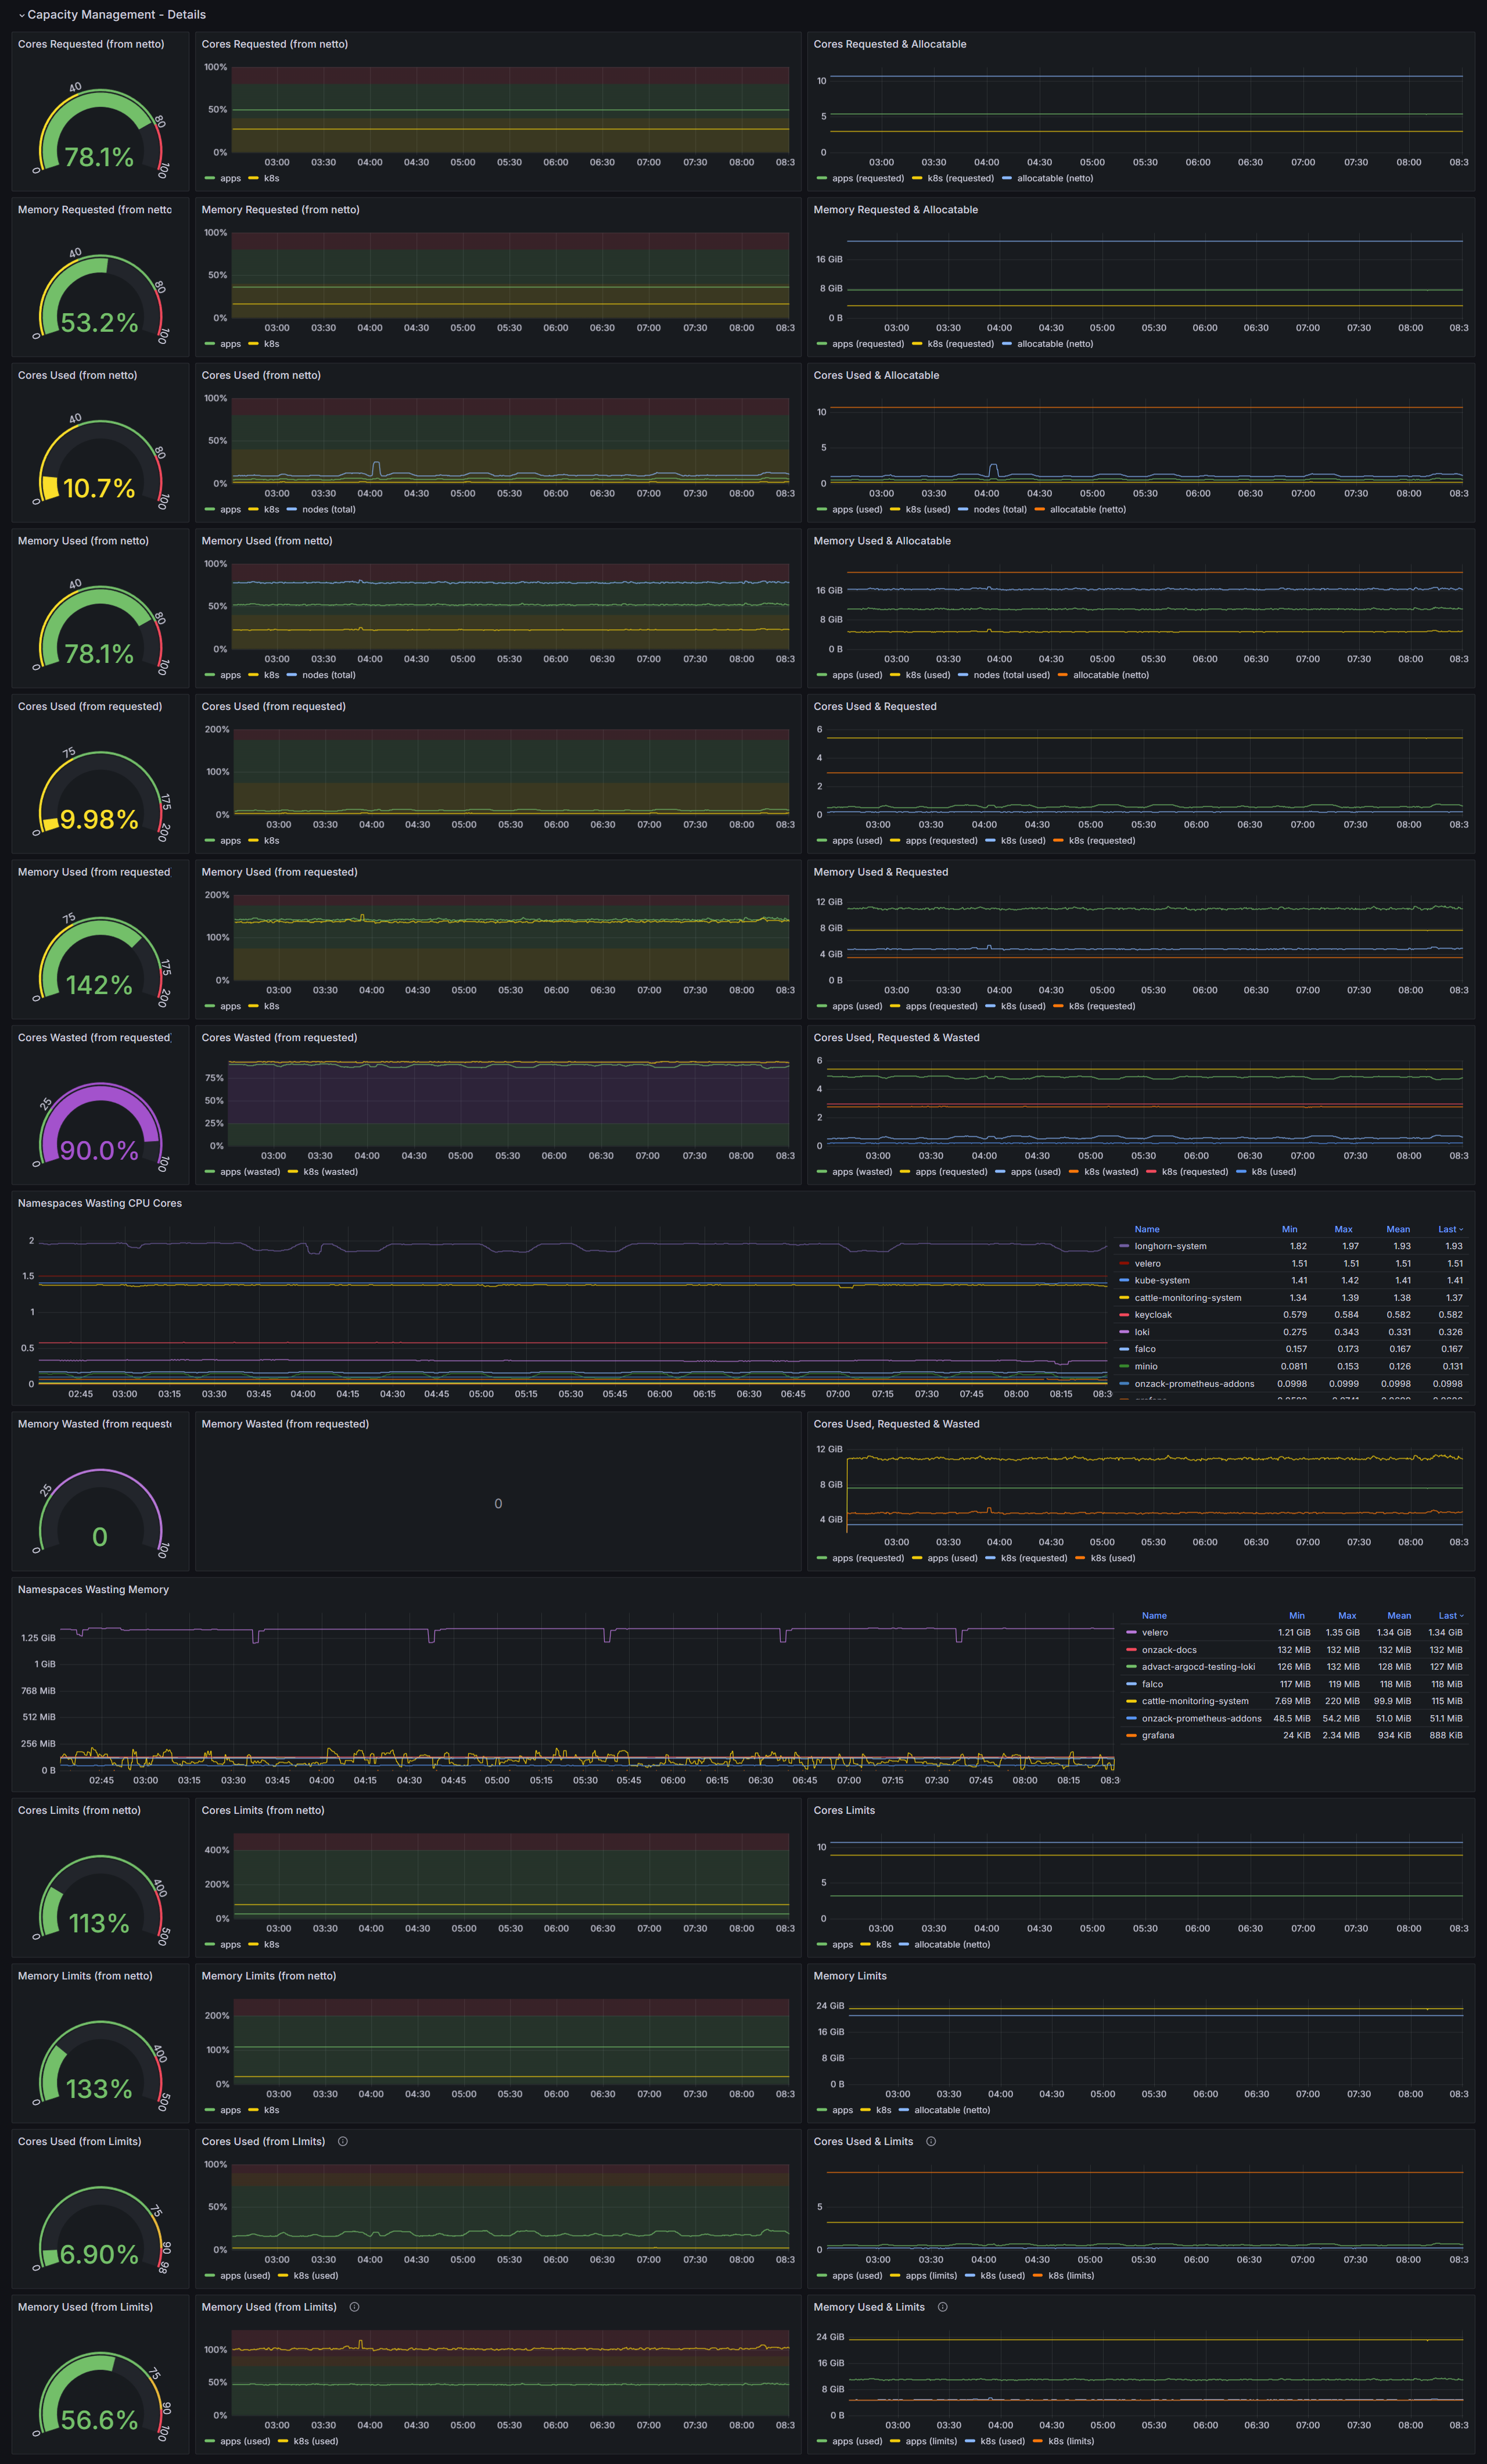
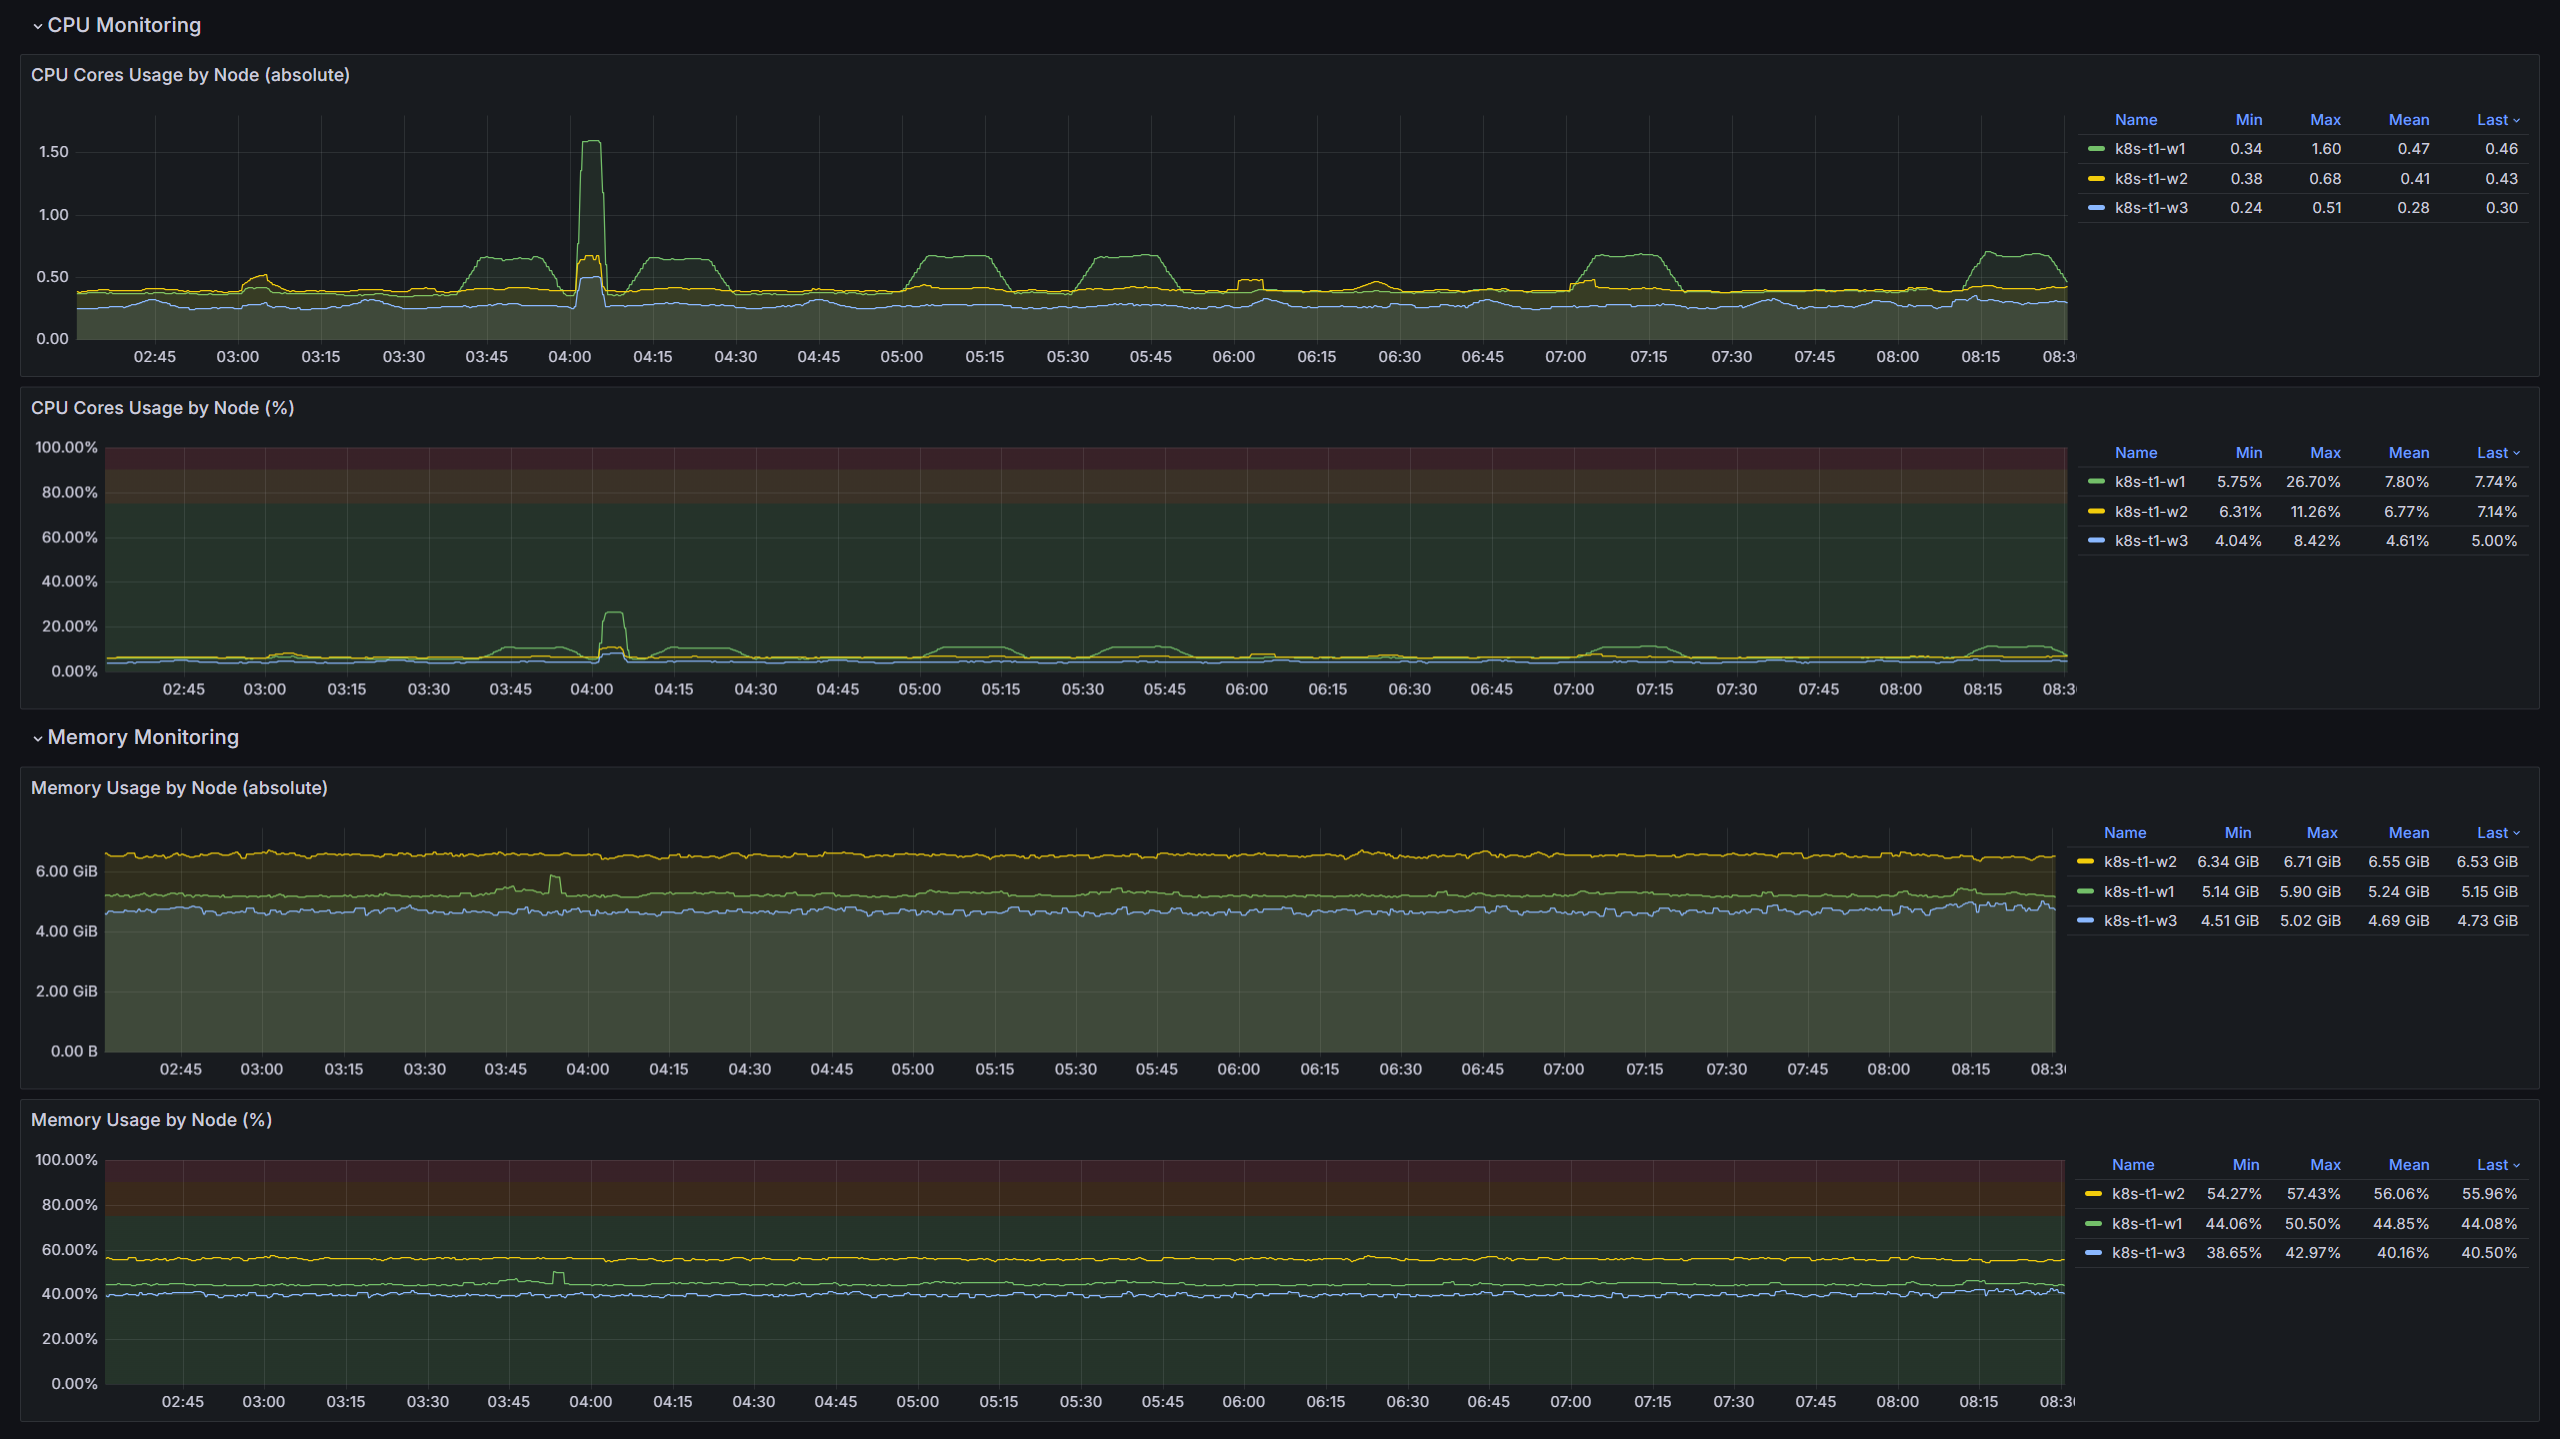
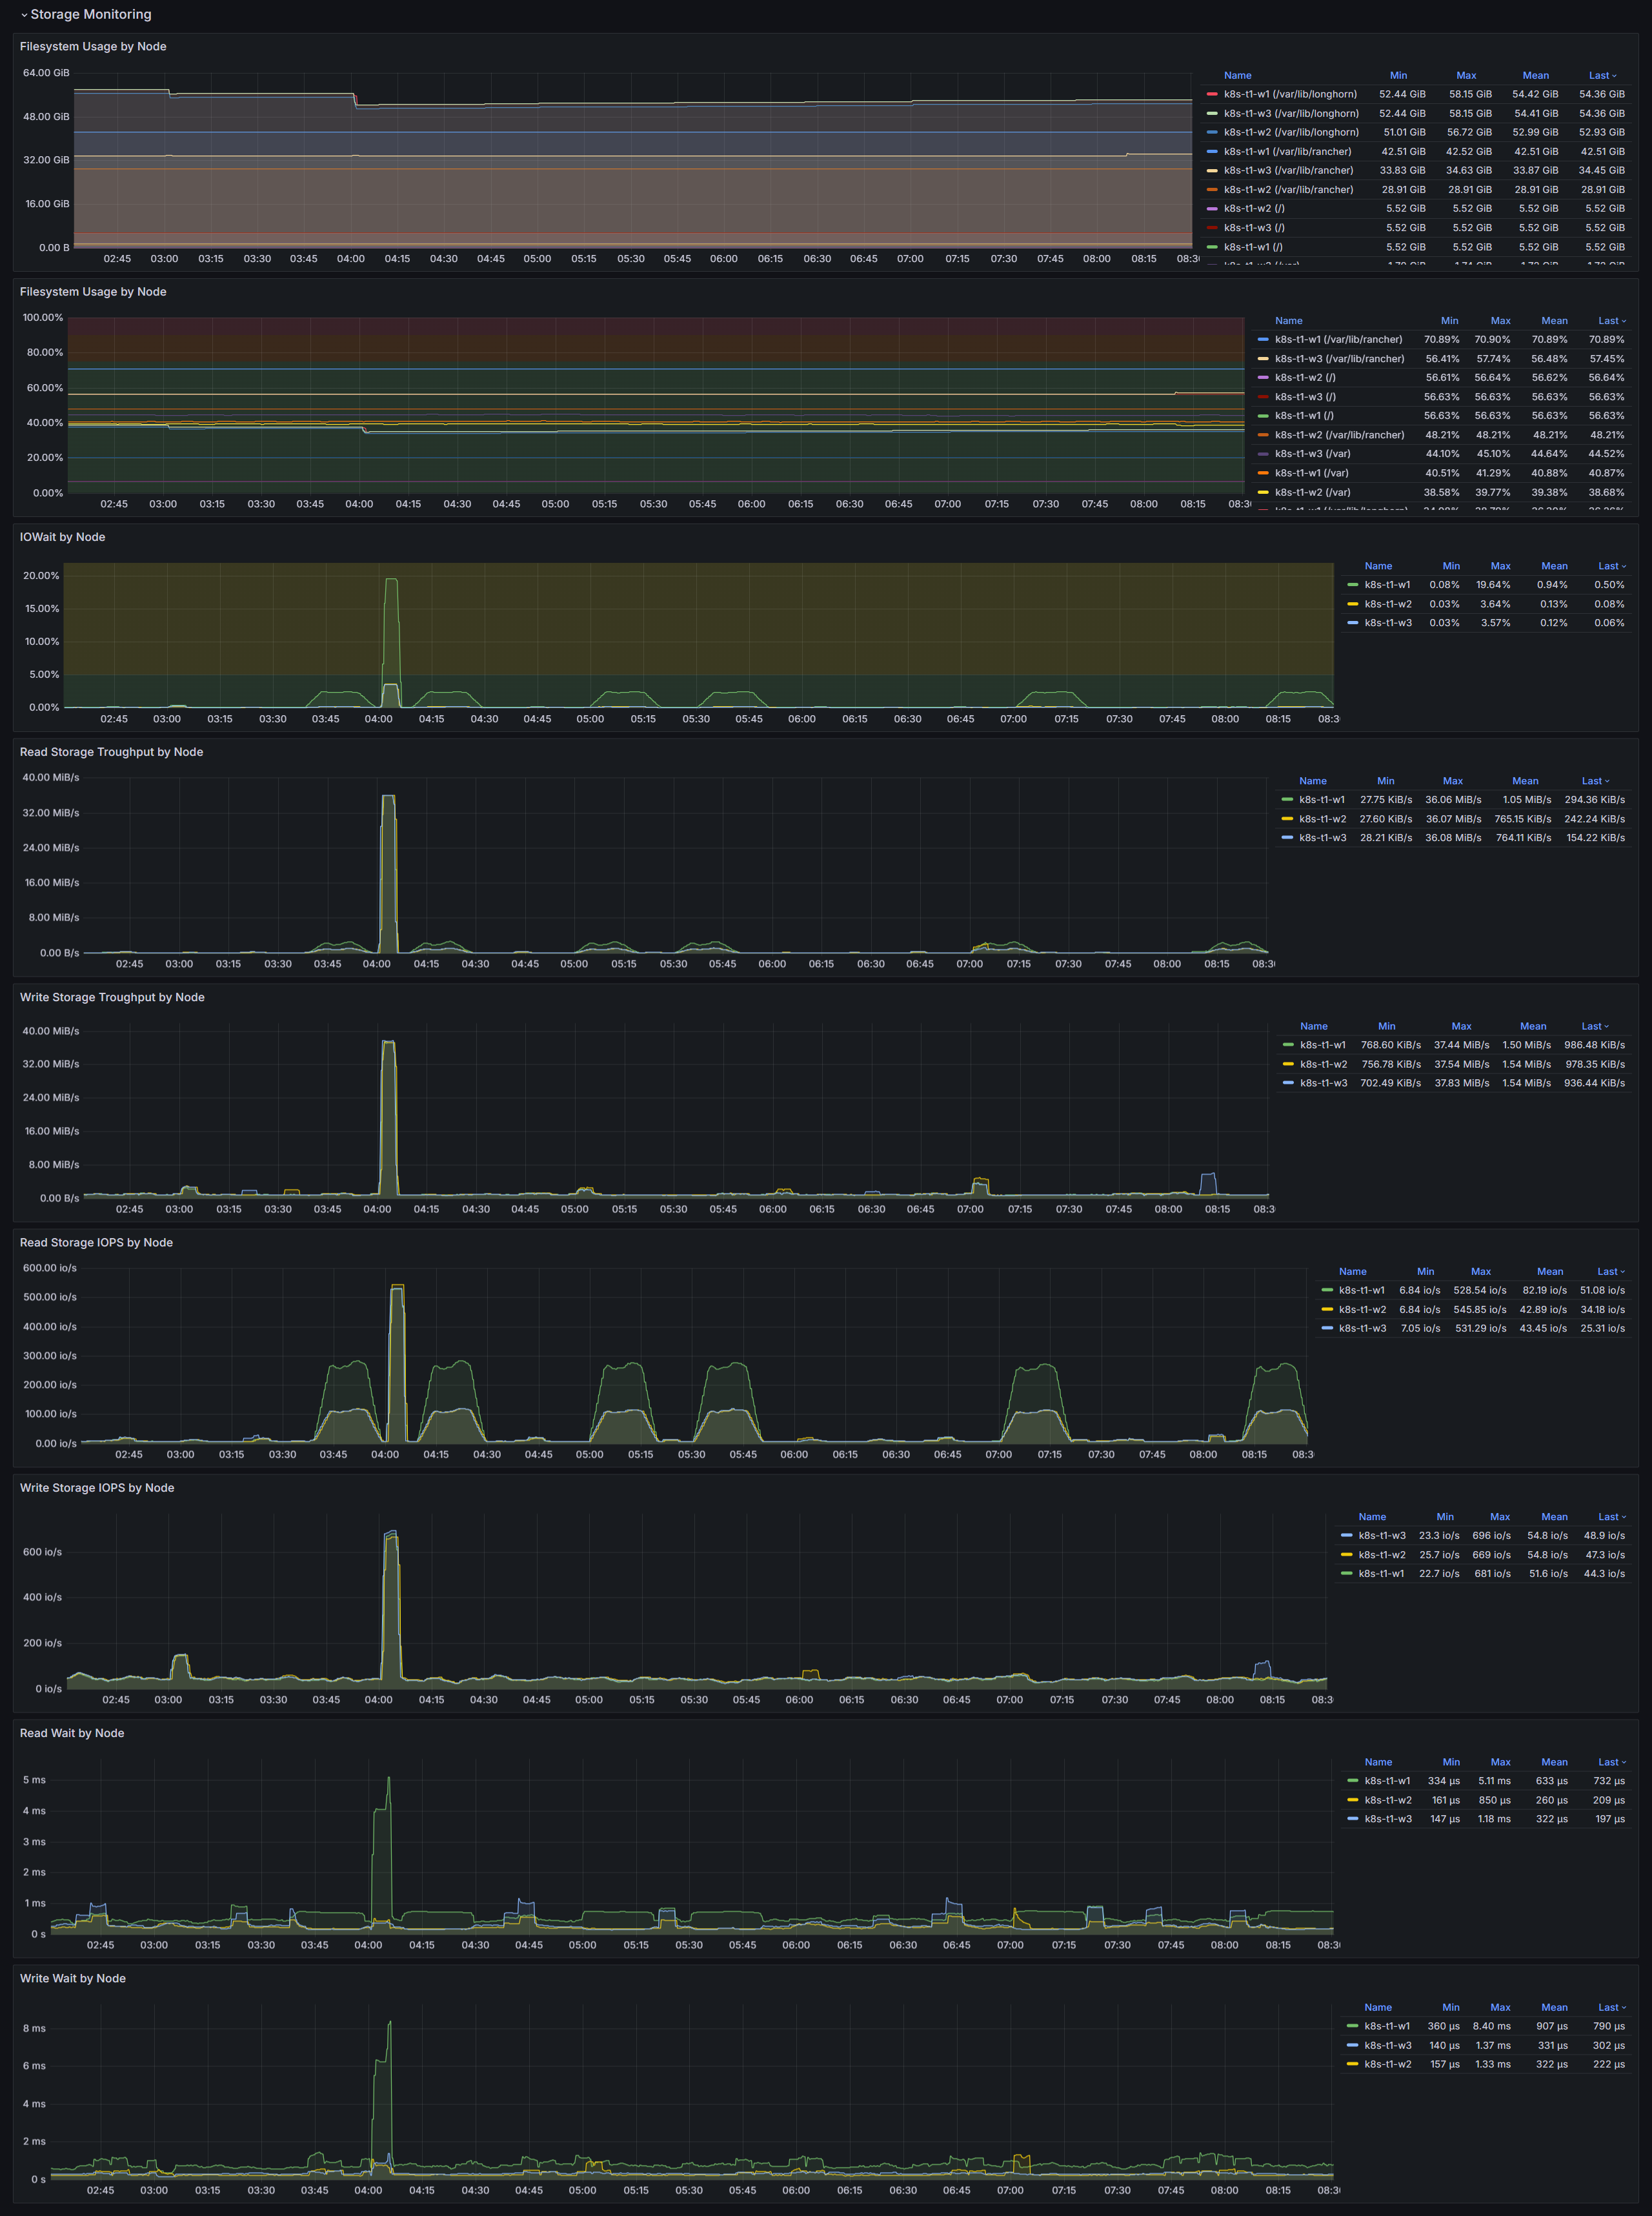
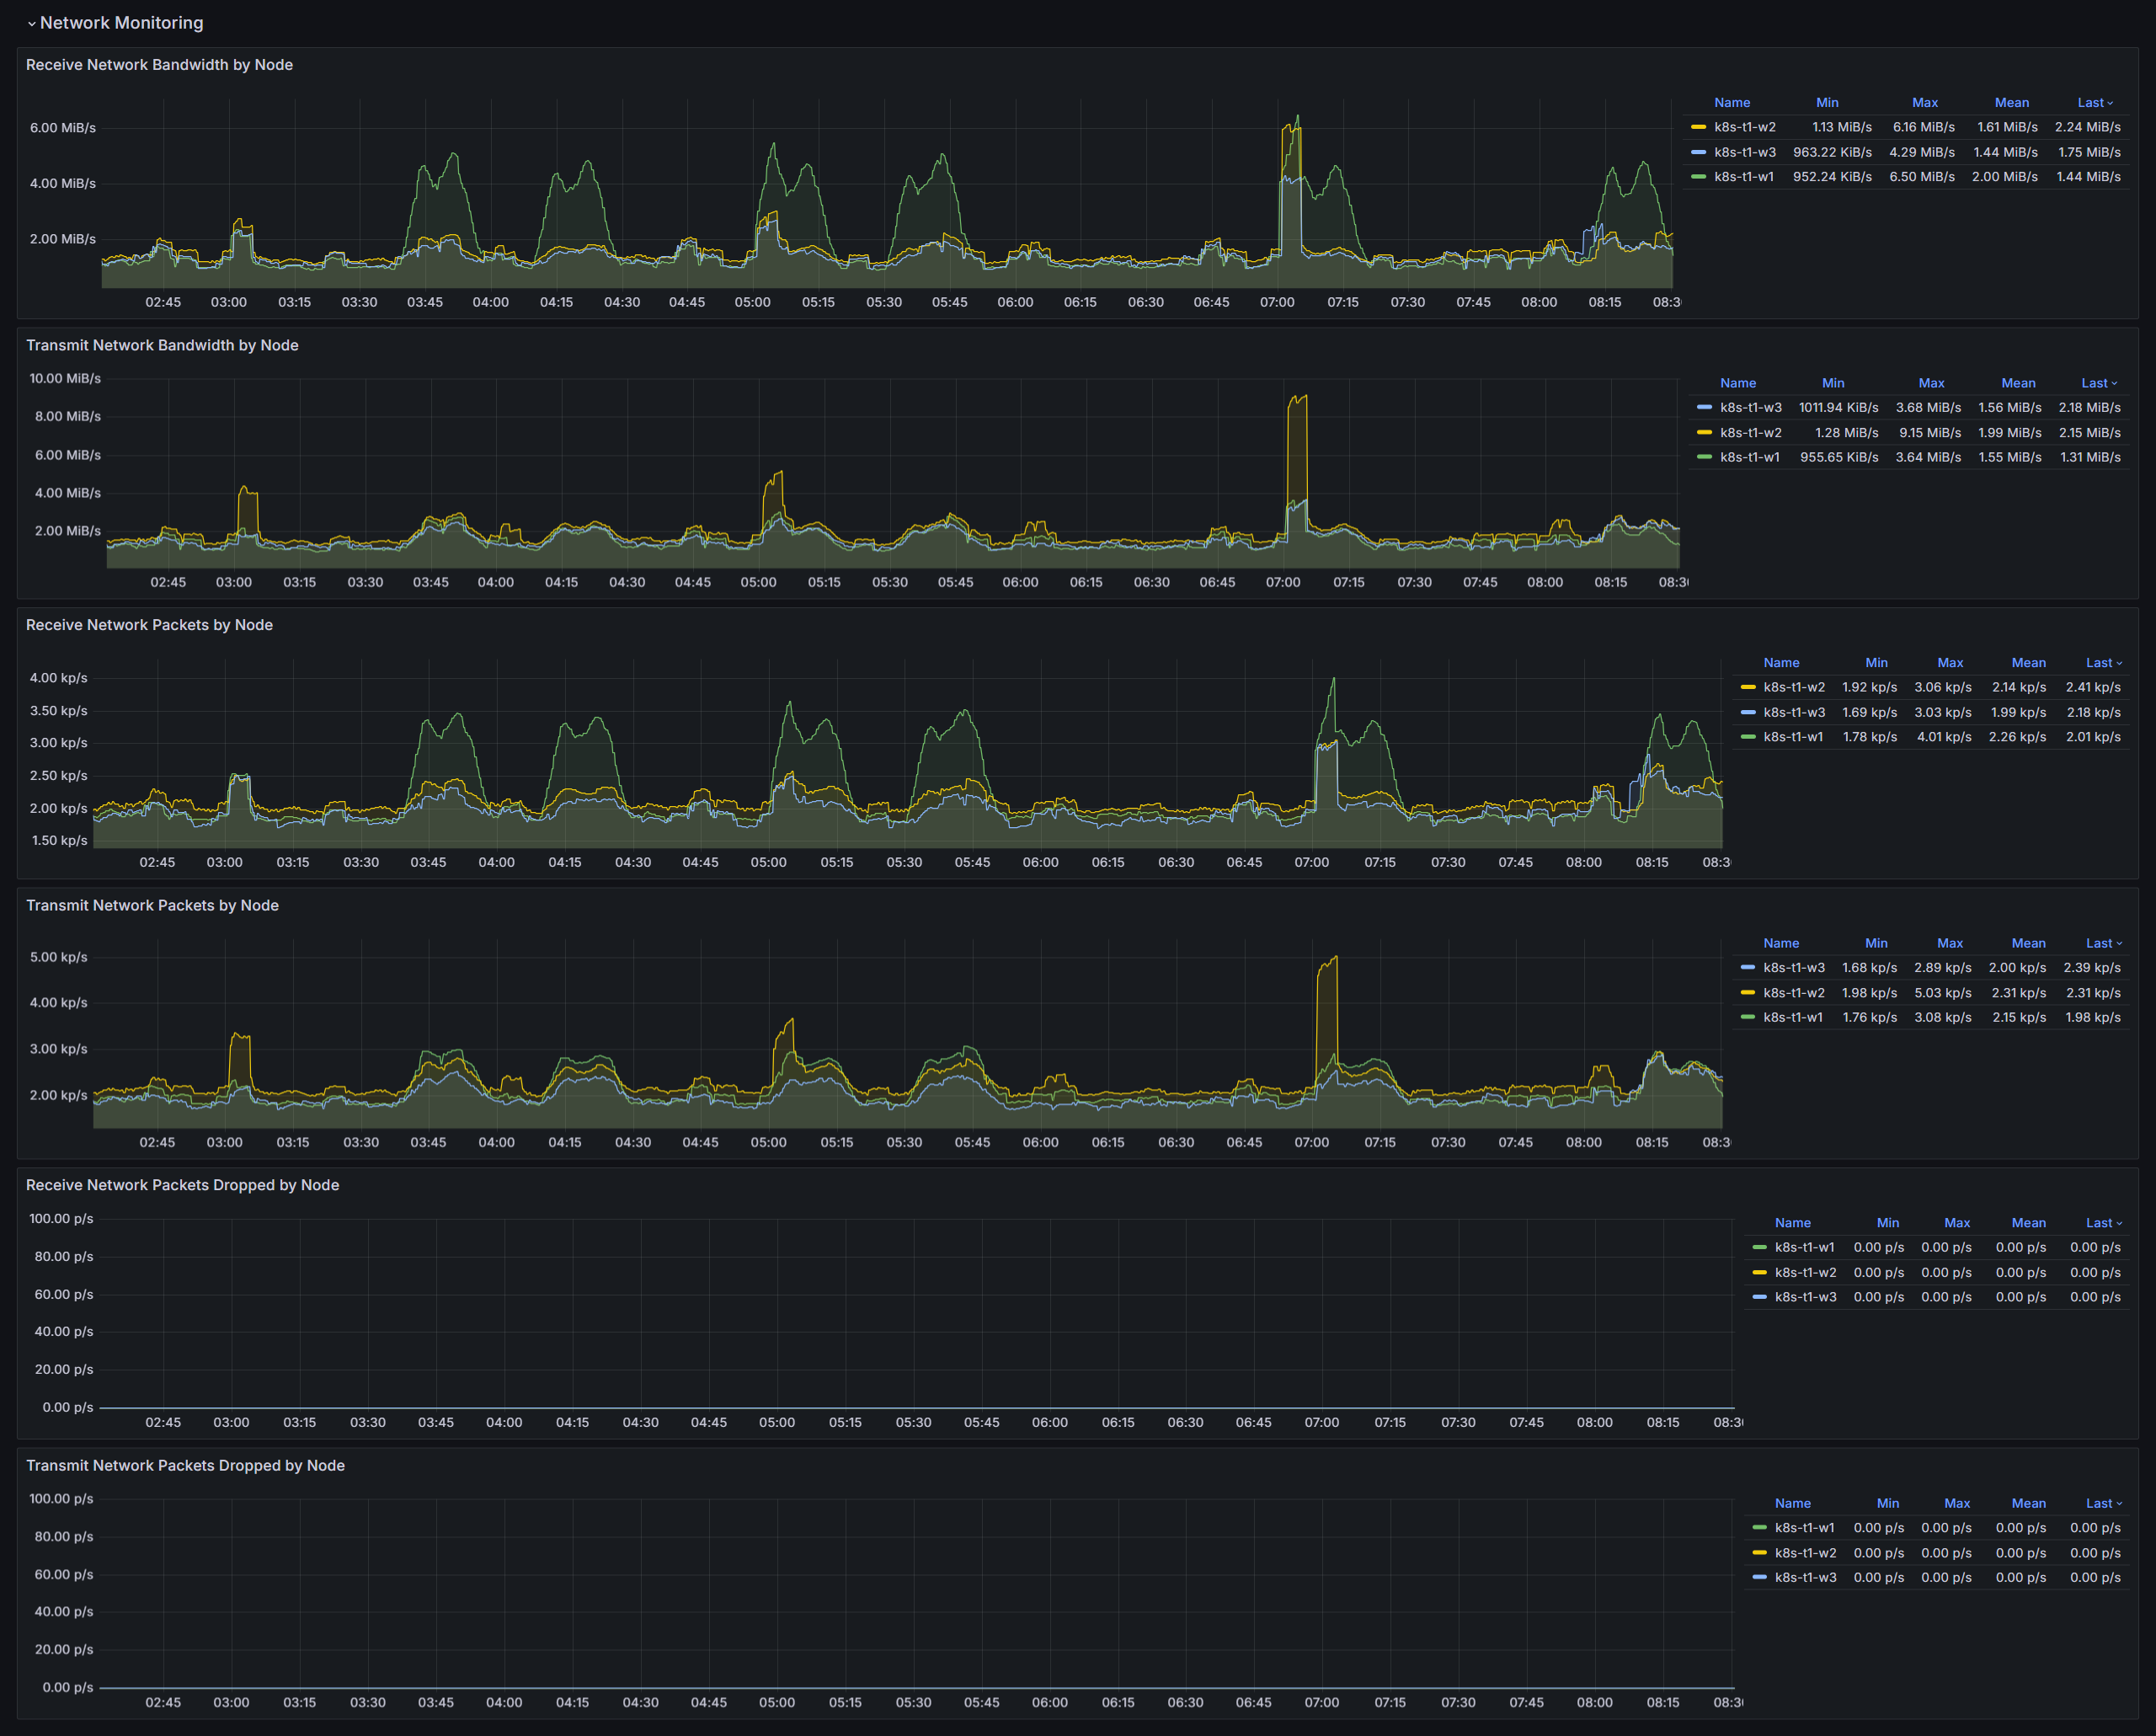
Standard Kubernetes/OpenShift cluster monitoring dashboard (needs Prometheus recording rules)
Screenshots
Used Metrics 1818
instance:kube_node_role
kube_node_info
kube_node_spec_unschedulable
kube_node_status_capacity:cpu:sum
kube_node_status_capacity:memory:sum
kube_node_status_condition
kubelet_runtime_operations_errors_total
node_cpu_seconds_total:sum_rate
node_disk_read_bytes_total:sum_rate
node_disk_written_bytes_total:sum_rate
node_memory_MemUsed_bytes:sum
node_network_receive_bytes_total:sum_rate
node_network_transmit_bytes_total:sum_rate
nodecpumemreserve
role:kube_node_status_capacity:cpu:avg
role:kube_node_status_capacity:memory:avg
sparenodesfactor
topk
Get Dashboard✕
Download
Copy to Clipboard