SQL Server Monitoring 2,4732,473 3.0 (1 reviews)
4/5/2017
4/5/2017
1
DatabasesHost Metrics
>=v4.0.2
Prometheus
Description
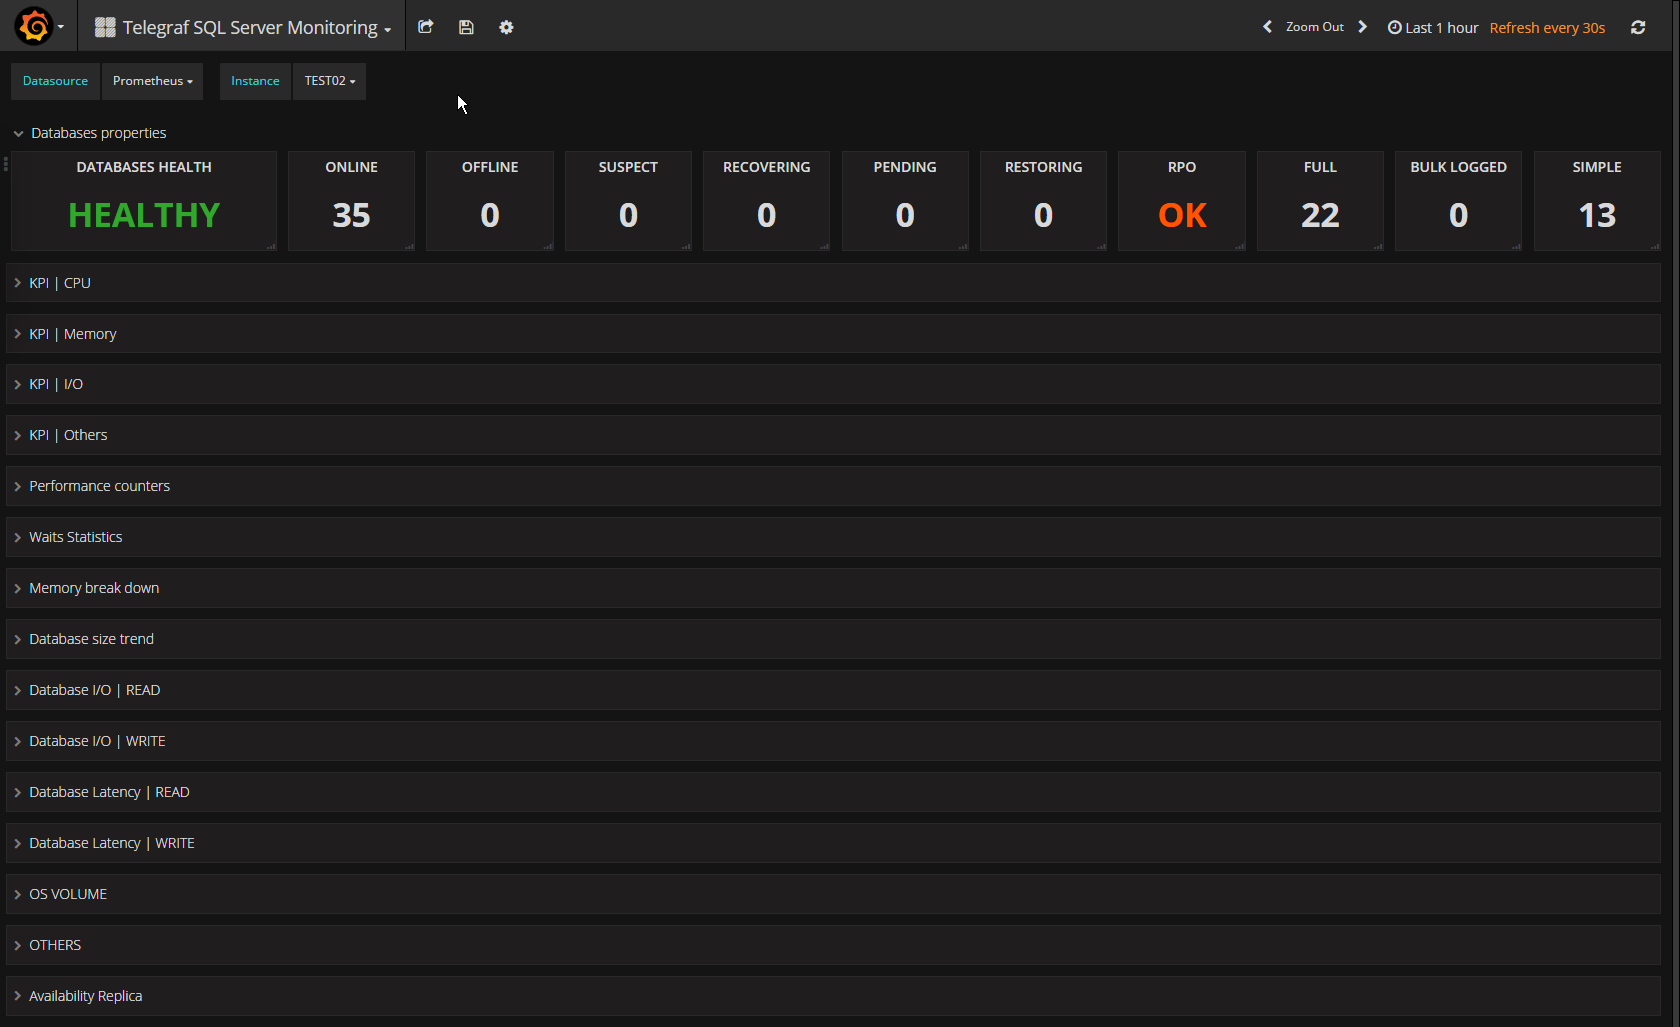
Performance and health metrics for your SQL Servers using Telegraf and Prometheus
Screenshots
Get Dashboard✕
Download
Copy to Clipboard