Spring Cloud Data Flow (SCDF) Tasks Prometheus 61,02661,026
Description
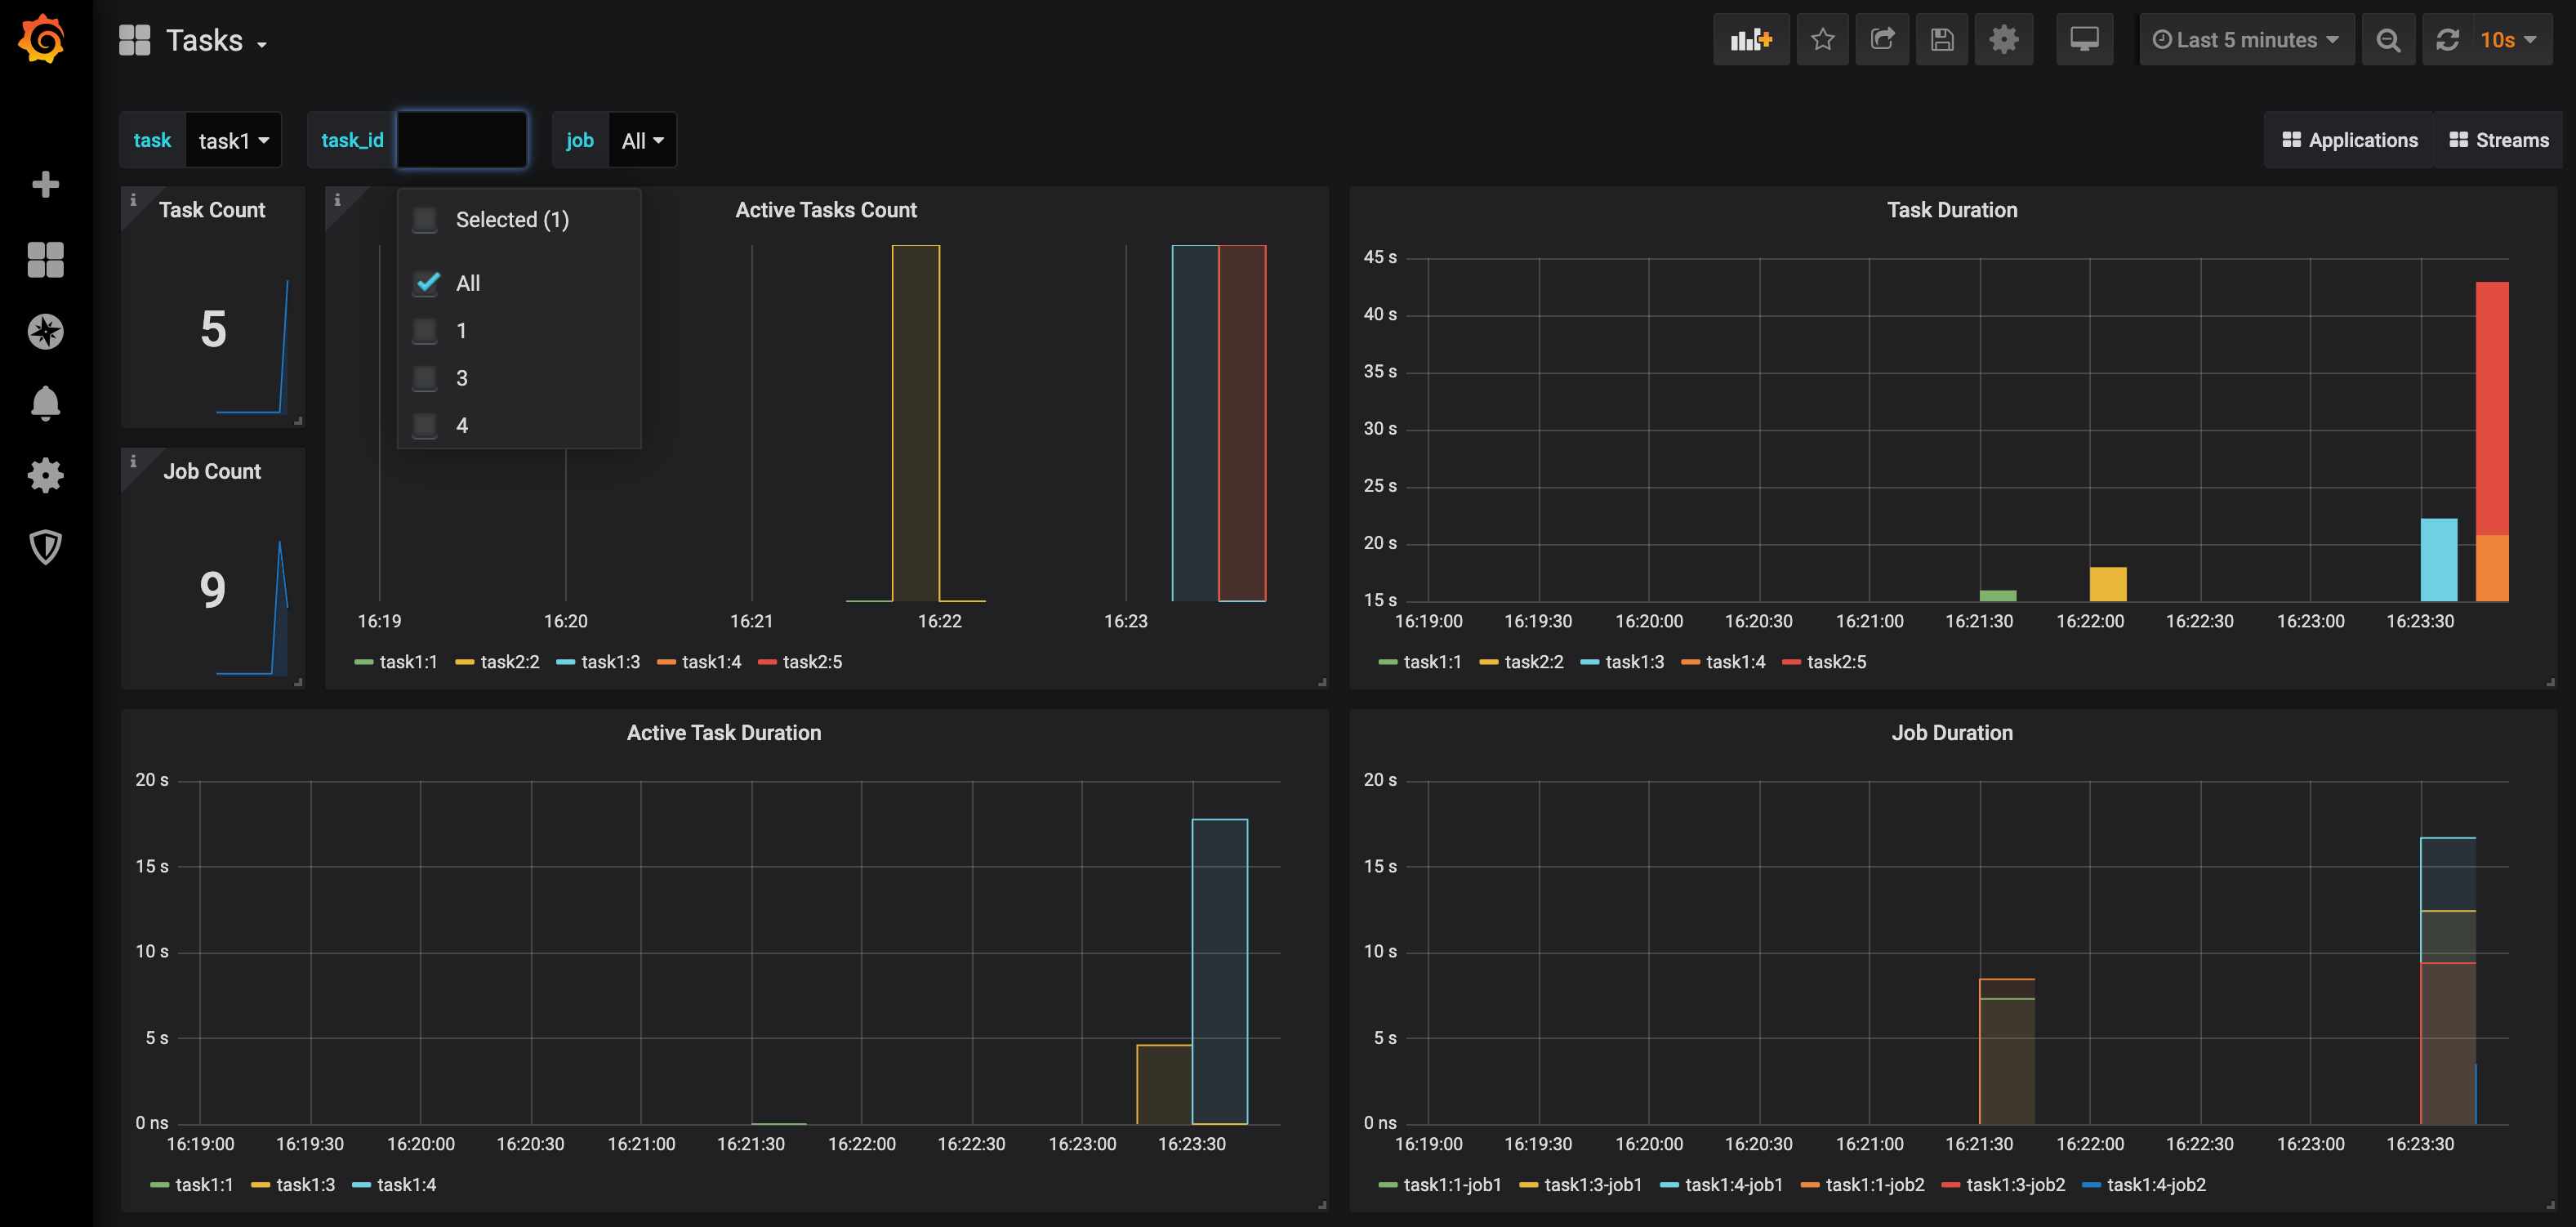
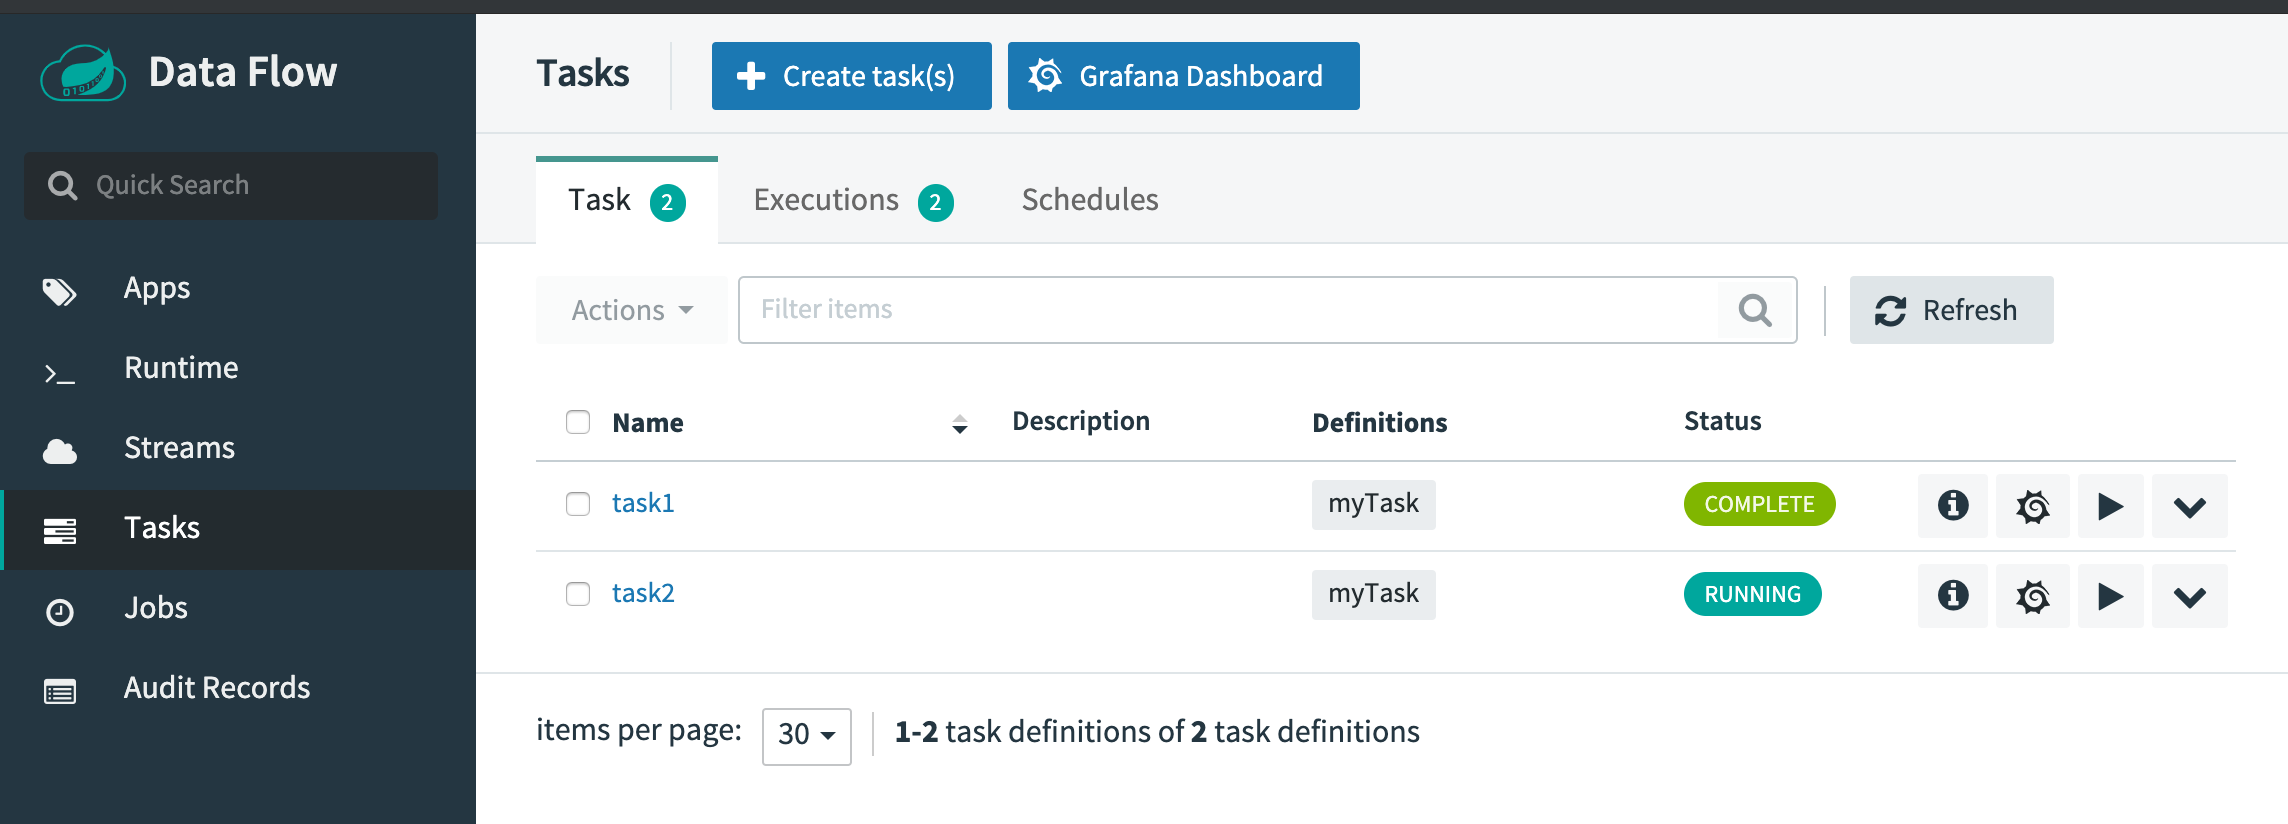
This dashboard monitors Spring Cloud Data Flow (SCDF) tasks and batch jobs by aggregating run counts, active executions, and durations to reveal throughput and latency characteristics. It highlights a few key metrics such as spring_cloud_task_seconds_count (task run count), spring_cloud_task_active_seconds_active_count (currently active tasks), and spring_batch_job_seconds_max (maximum job duration) to provide a concise view of throughput, concurrency, and runtime distribution, with additional panels tracking task and job rates and durations for quick drill-downs.
Screenshots
Used Metrics 66
spring_batch_job_active_seconds_active_count
spring_batch_job_seconds_max
spring_cloud_task_active_seconds_active_count
spring_cloud_task_active_seconds_duration_sum
spring_cloud_task_seconds_count
spring_cloud_task_seconds_sum