Spring Cloud Data Flow (SCDF) Streams Prometheus 61,60861,608
3/17/2019
3/23/2020
3
>=6.3.5
Prometheus
Description
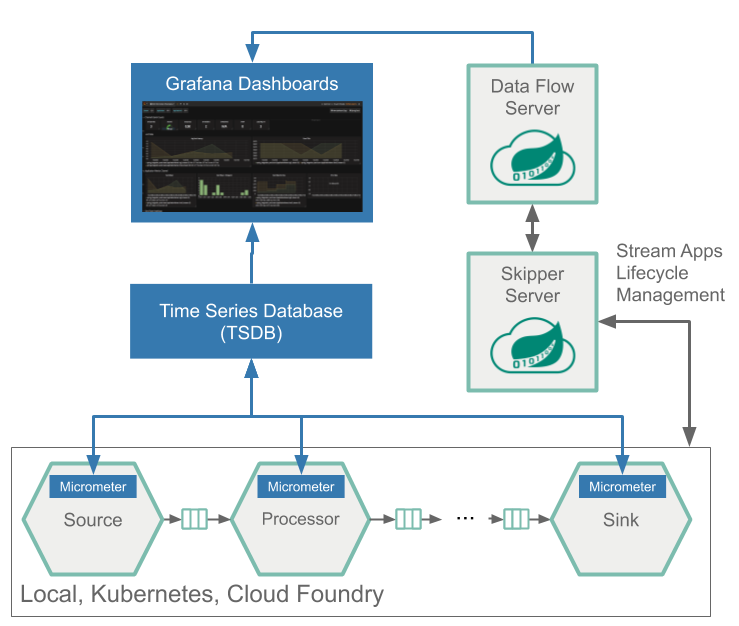
This dashboard monitors Spring Cloud Data Flow (SCDF) streams by aggregating runtime, resource, and reliability metrics to give a holistic view of stream health and throughput. It highlights throughput and latency trends with metrics like spring_integration_send_seconds_sum and spring_integration_send_seconds_count, resource usage through jvm_memory_used_bytes and process_cpu_usage, and system reliability via tomcat_global_error_total and jvm_threads_live_threads to surface potential bottlenecks and failures.
Screenshots
Used Metrics 99
jvm_memory_used_bytes
jvm_threads_live_threads
process_cpu_usage
process_files_open_files
spring_integration_receive_total
spring_integration_send_seconds_count
spring_integration_send_seconds_sum
system_cpu_usage
tomcat_global_error_total
Get Dashboard✕
Download
Copy to Clipboard