Spring Cloud Data Flow (SCDF) Applications Prometheus 40,45740,457
Description
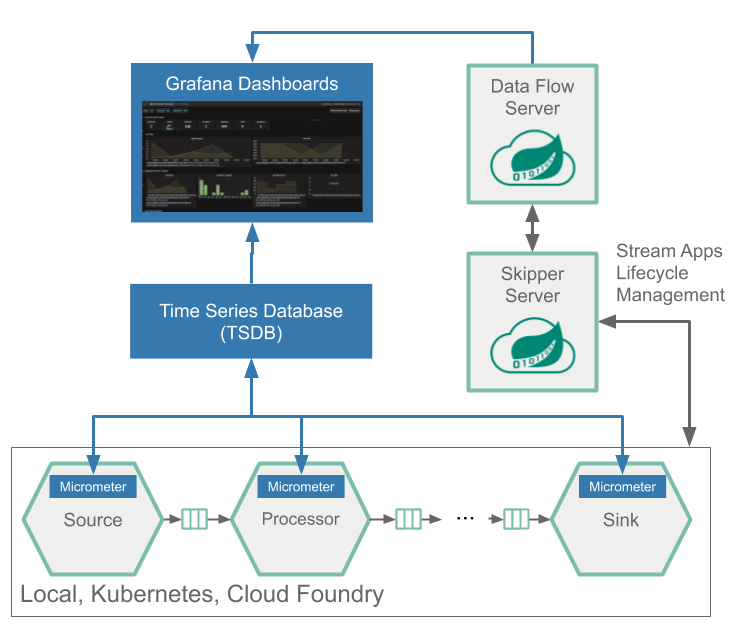
This Prometheus-backed Grafana dashboard monitors Spring Cloud Data Flow (SCDF) applications, offering an at-a-glance view of runtime health and throughput across apps, channels, and handlers. It emphasizes resource usage and message flow metrics, including CPU and memory utilization via process_cpu_usage and jvm_memory_used_bytes, thread/activity levels with jvm_threads_live_threads, and integration throughput and latency through spring_integration_send_seconds_count/spring_integration_send_seconds_sum and spring_integration_receive_total. The panels also cover file descriptors, class loading, and channel/handler counts to help diagnose capacity and scalability issues.
Screenshots
Used Metrics 1111
jvm_classes_loaded_classes
jvm_memory_used_bytes
jvm_threads_live_threads
process_cpu_usage
process_files_open_files
spring_integration_channels
spring_integration_handlers
spring_integration_receive_total
spring_integration_send_seconds_count
spring_integration_send_seconds_sum
spring_integration_sources