Spring Boot Statistics 15,18415,184 3.0 (1 reviews)
6/13/2020
6/16/2020
2
DatabasesHost MetricsWeb Servers
>=7.0.1
Prometheus
Description
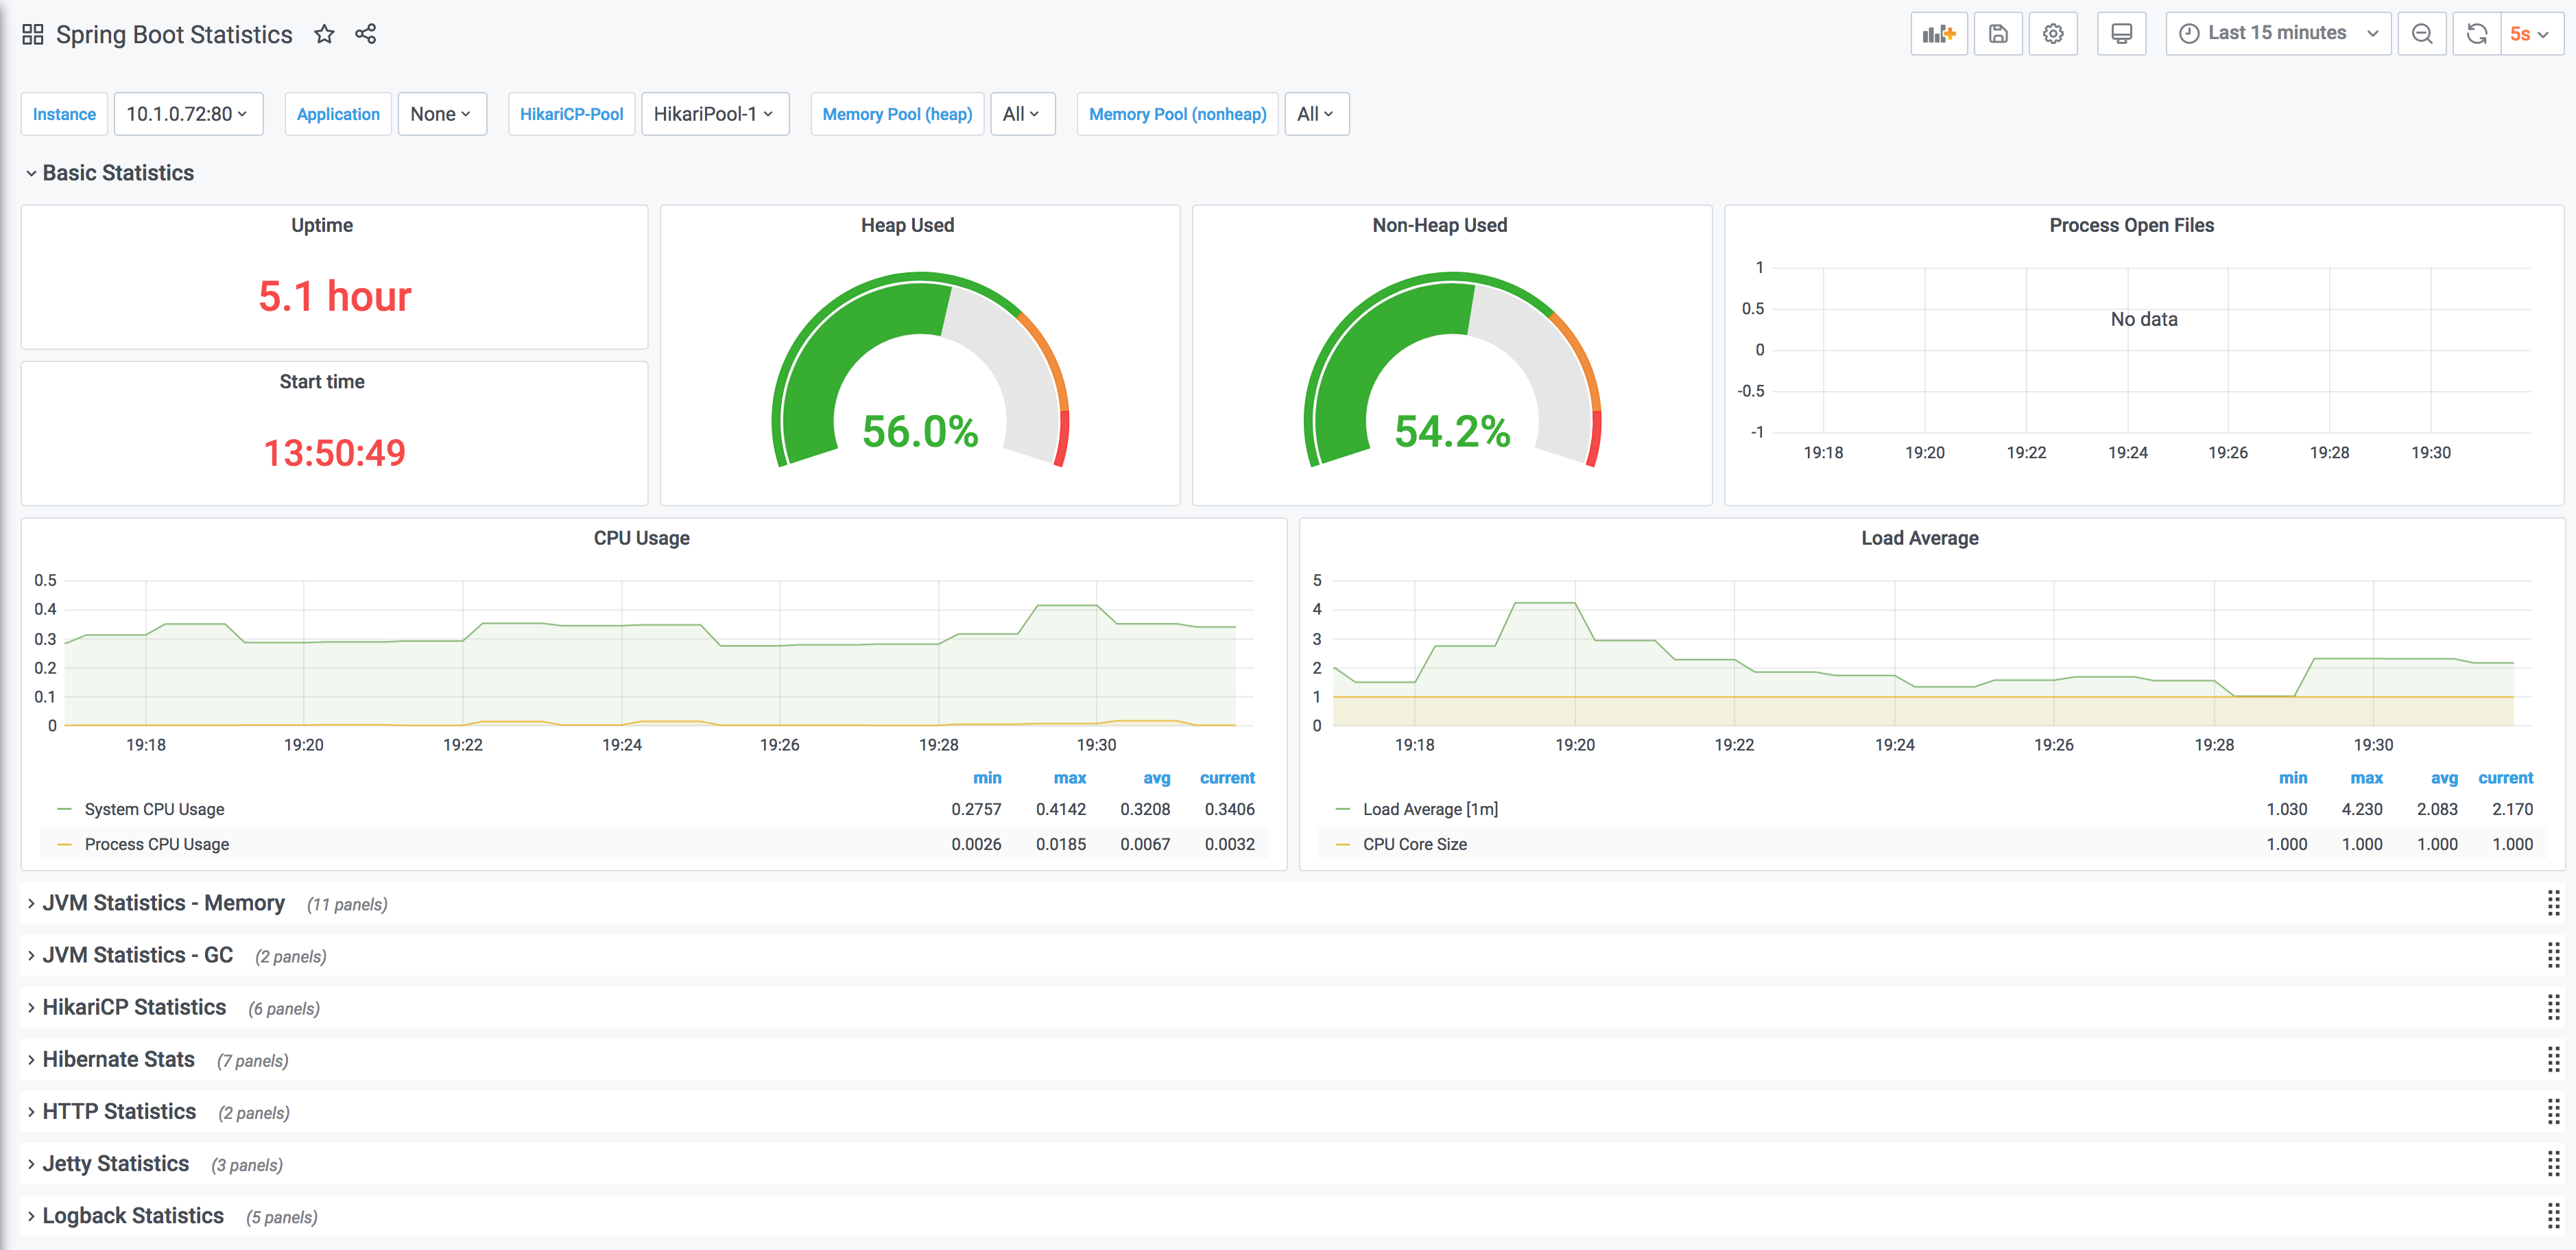
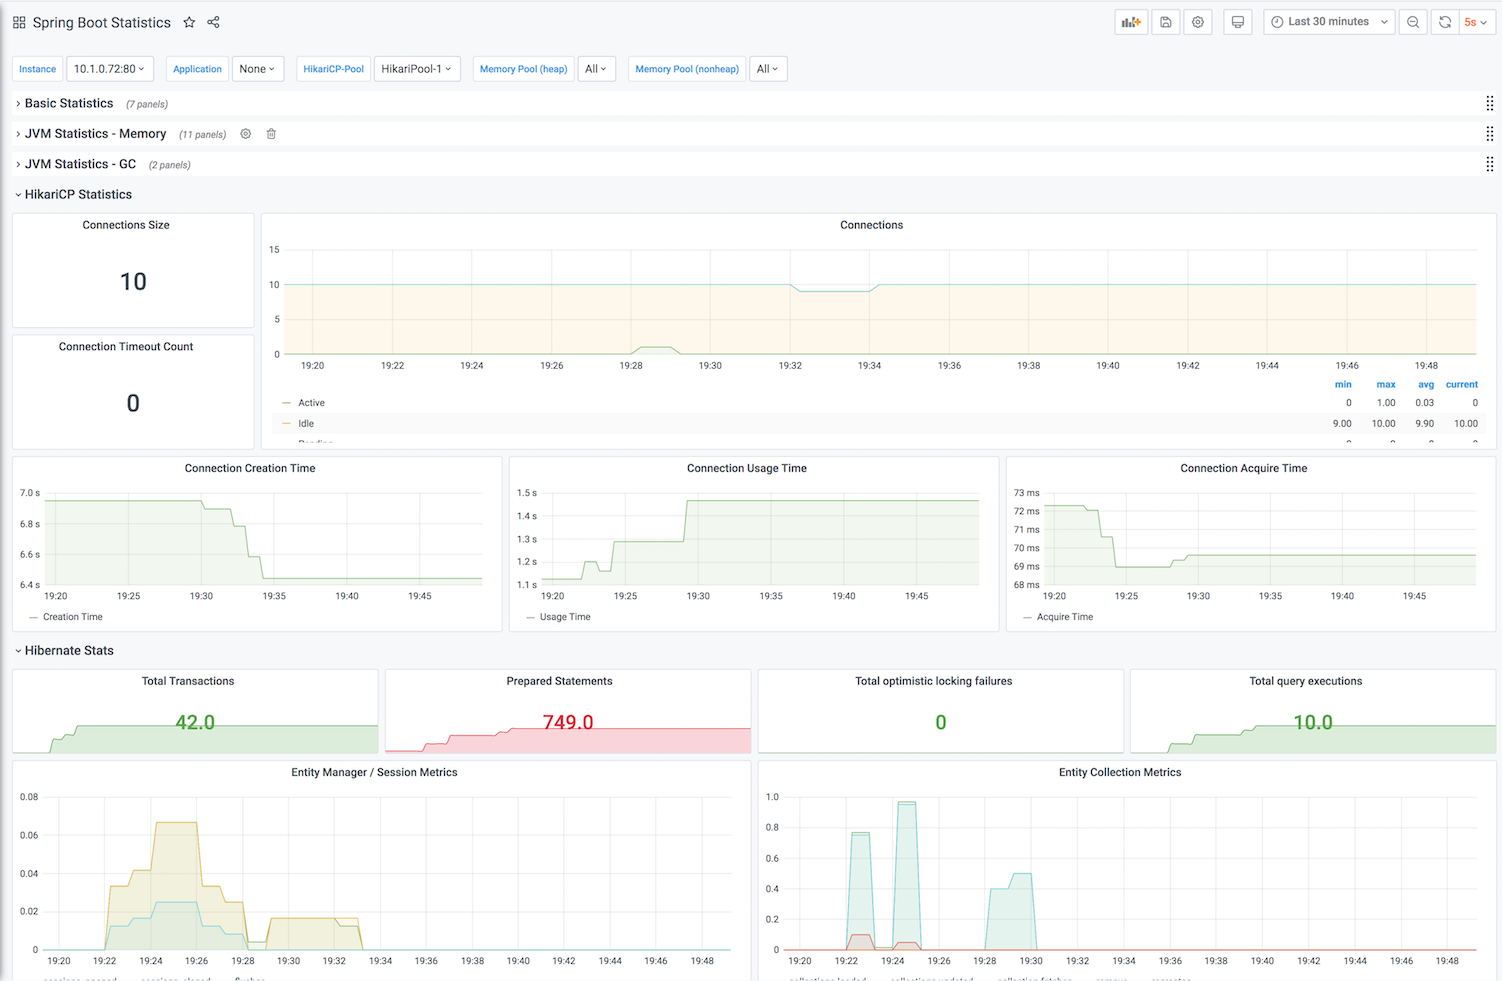
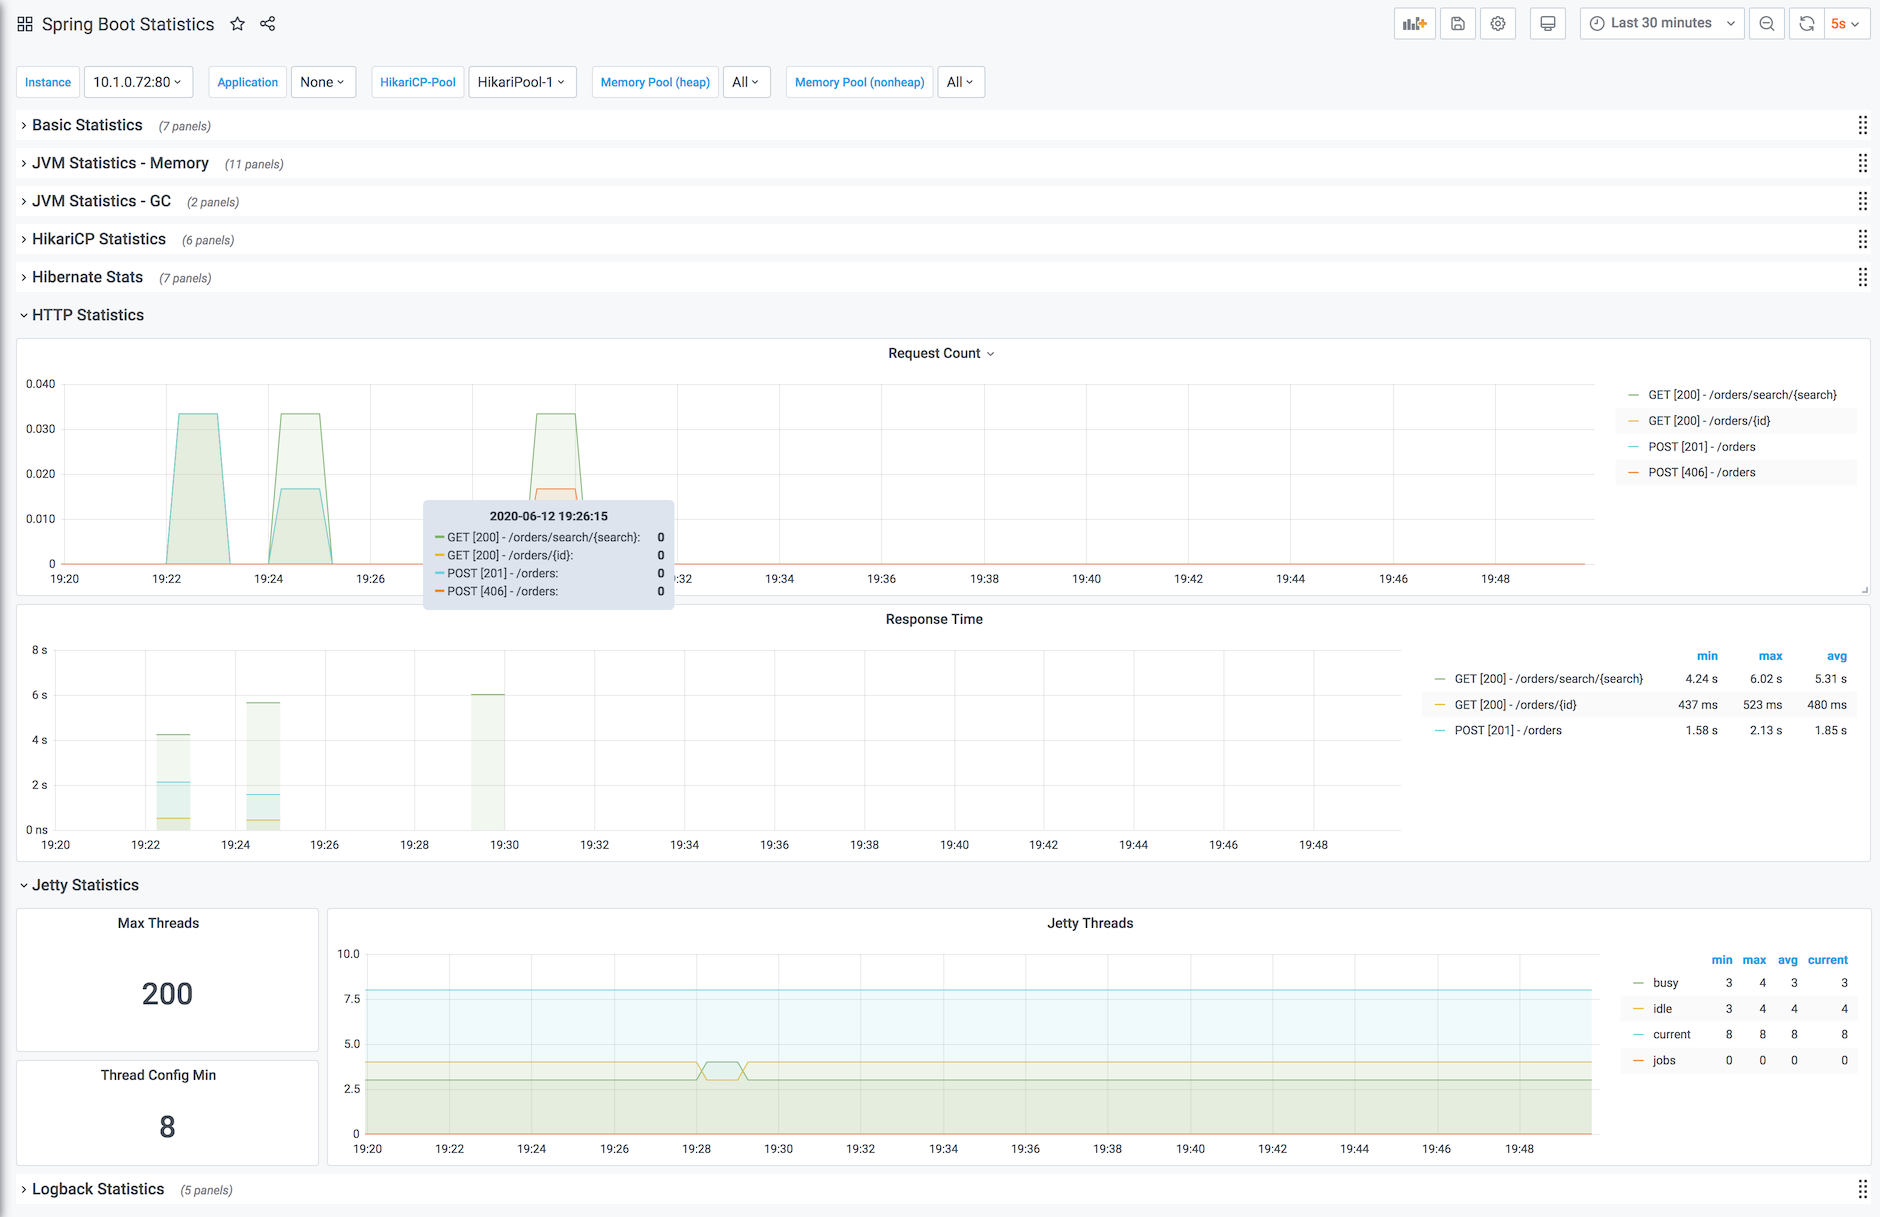
Dashboard for Spring Boot2 Statistics(by micrometer-prometheus). This is a fork of dashboard 6756, fixed for Spring Boot 2.3 and support for Jetty instead of Tomcat.
Screenshots
Used Metrics 1717
hibernate_collections_deletes_total
hibernate_collections_fetches_total
hibernate_collections_loads_total
hibernate_collections_recreates_total
hibernate_collections_updates_total
hibernate_entities_deletes_total
hibernate_entities_fetches_total
hibernate_entities_inserts_total
hibernate_entities_recreates_total
hibernate_entities_updates_total
hibernate_flushes_total
hibernate_optimistic_failures_total
hibernate_query_executions_total
hibernate_sessions_closed_total
hibernate_sessions_open_total
hibernate_statements_total
hibernate_transactions_total
Get Dashboard✕
Download
Copy to Clipboard