Spring Boot Observability 10,248,56910,248,569 5.0 (2 reviews)
Description
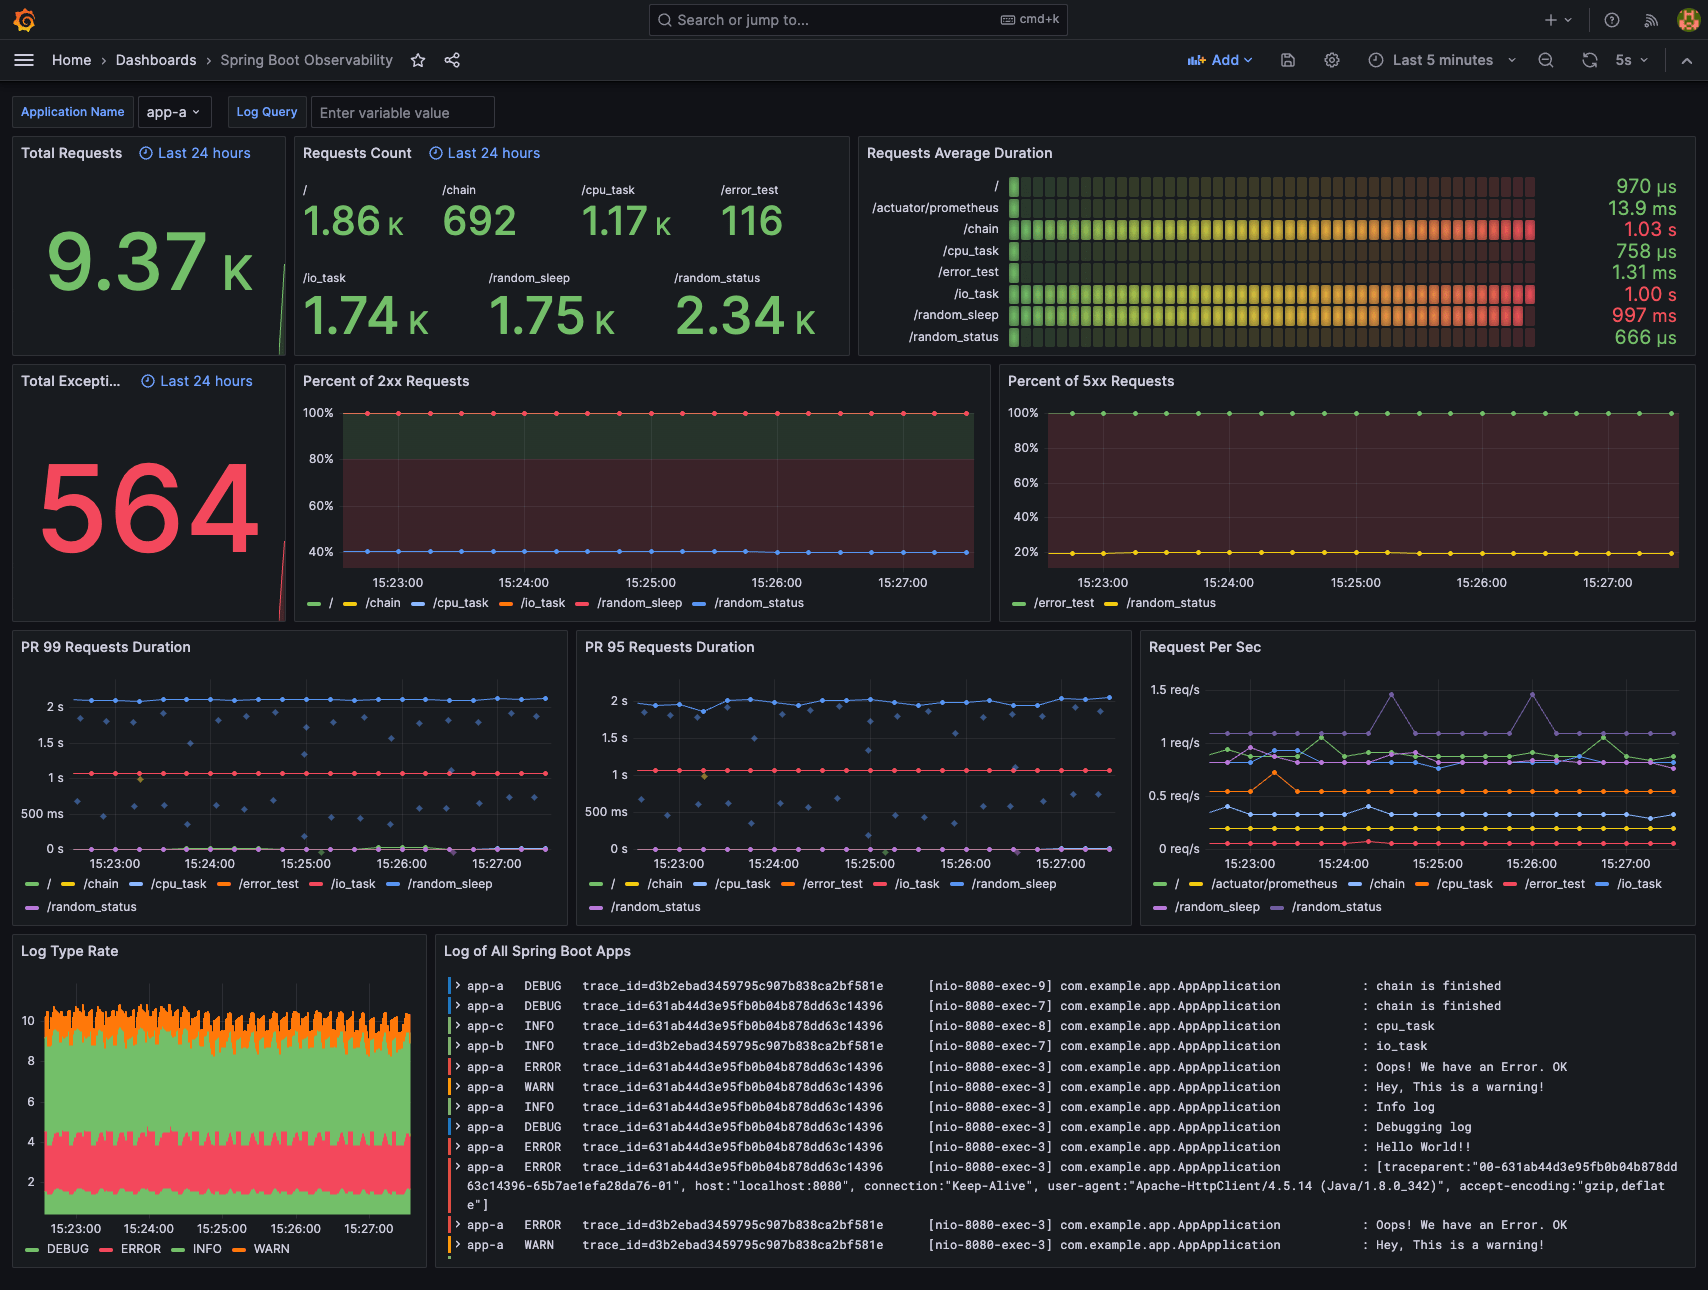
This dashboard monitors Spring Boot observability by aggregating request-level metrics and error rates to provide insight into API health and performance. It highlights latency and error distribution with panels like http_server_requests_seconds_count/http_server_requests_seconds_sum for duration, and http_server_requests_seconds_bucket for the percentile-based timing, alongside coverage of success vs. error responses such as 2xx and 5xx percentages. Additional context is provided through request rate and log-related panels, including Requests Per Sec, Percent of 2xx Requests, Percent of 5xx Requests, and log type rate for quick behavioral profiling.
Screenshots
Used Metrics 1515
_
date
http_server_requests_seconds_bucket
http_server_requests_seconds_count
http_server_requests_seconds_sum
line_format
log_keyword
msg
pattern
span_id
t
trace_flags
trace_id
ttrace_id
type