Spring Boot JDBC & HikariCP 2,9692,969
3/19/2024
3/28/2024
8
Databases
Prometheus
Description
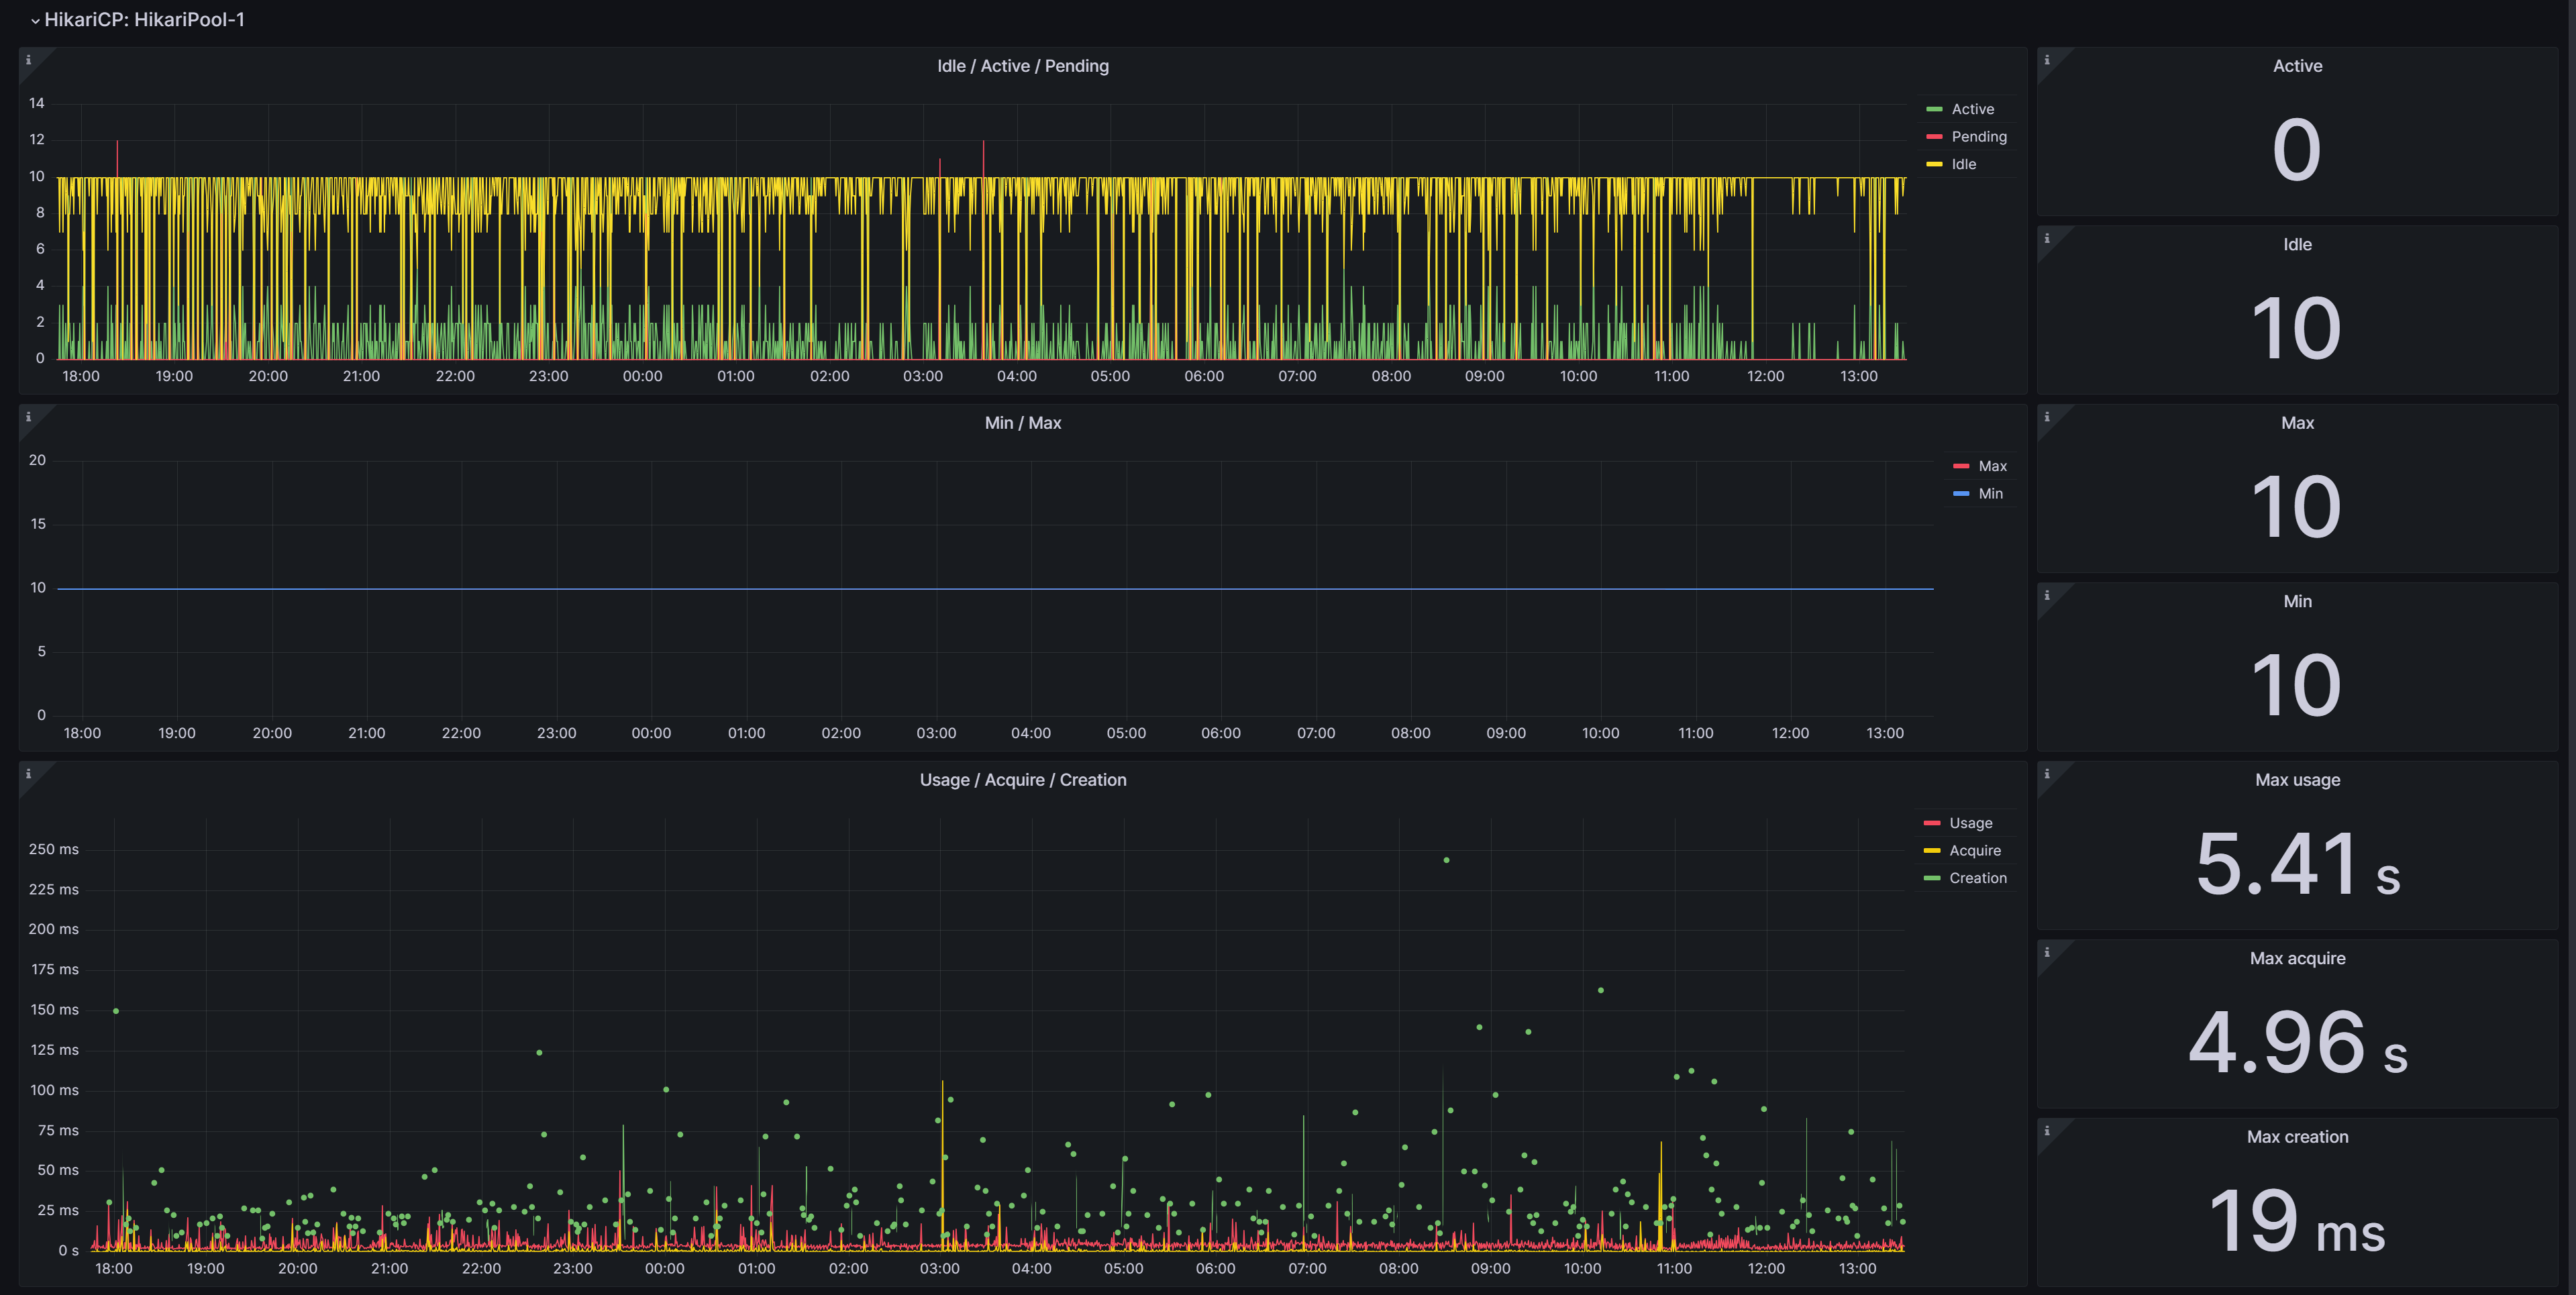
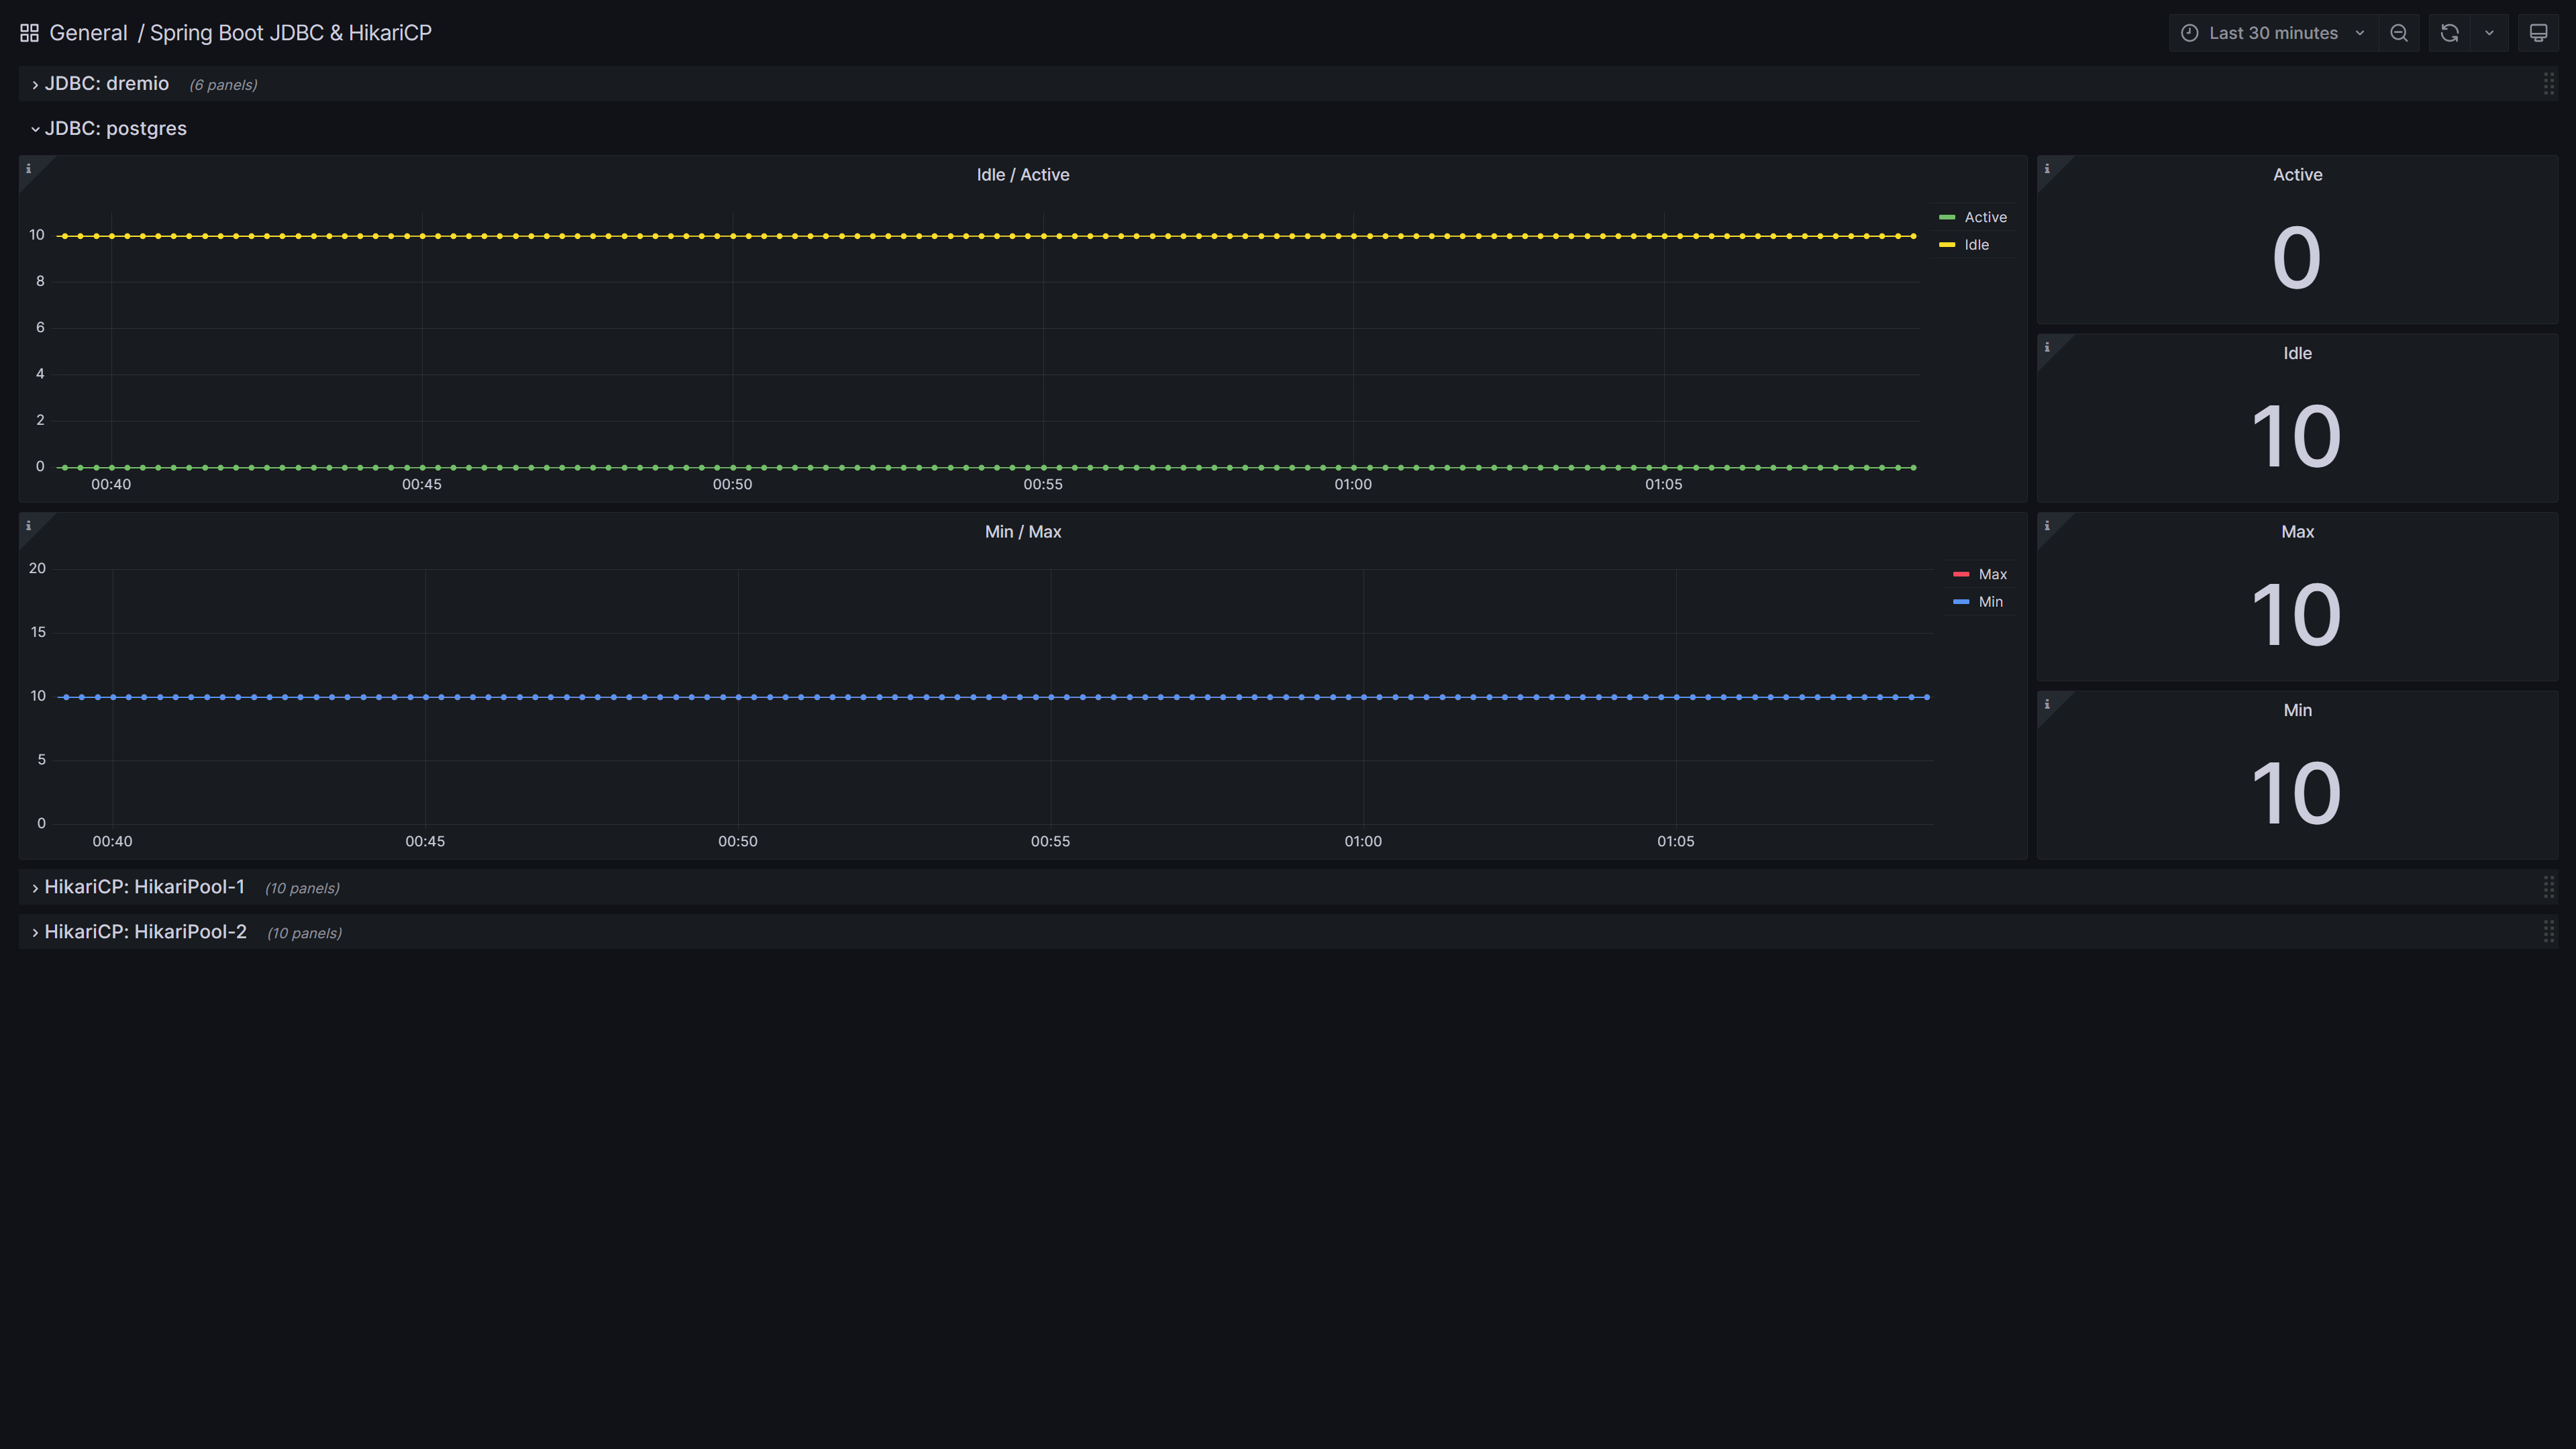
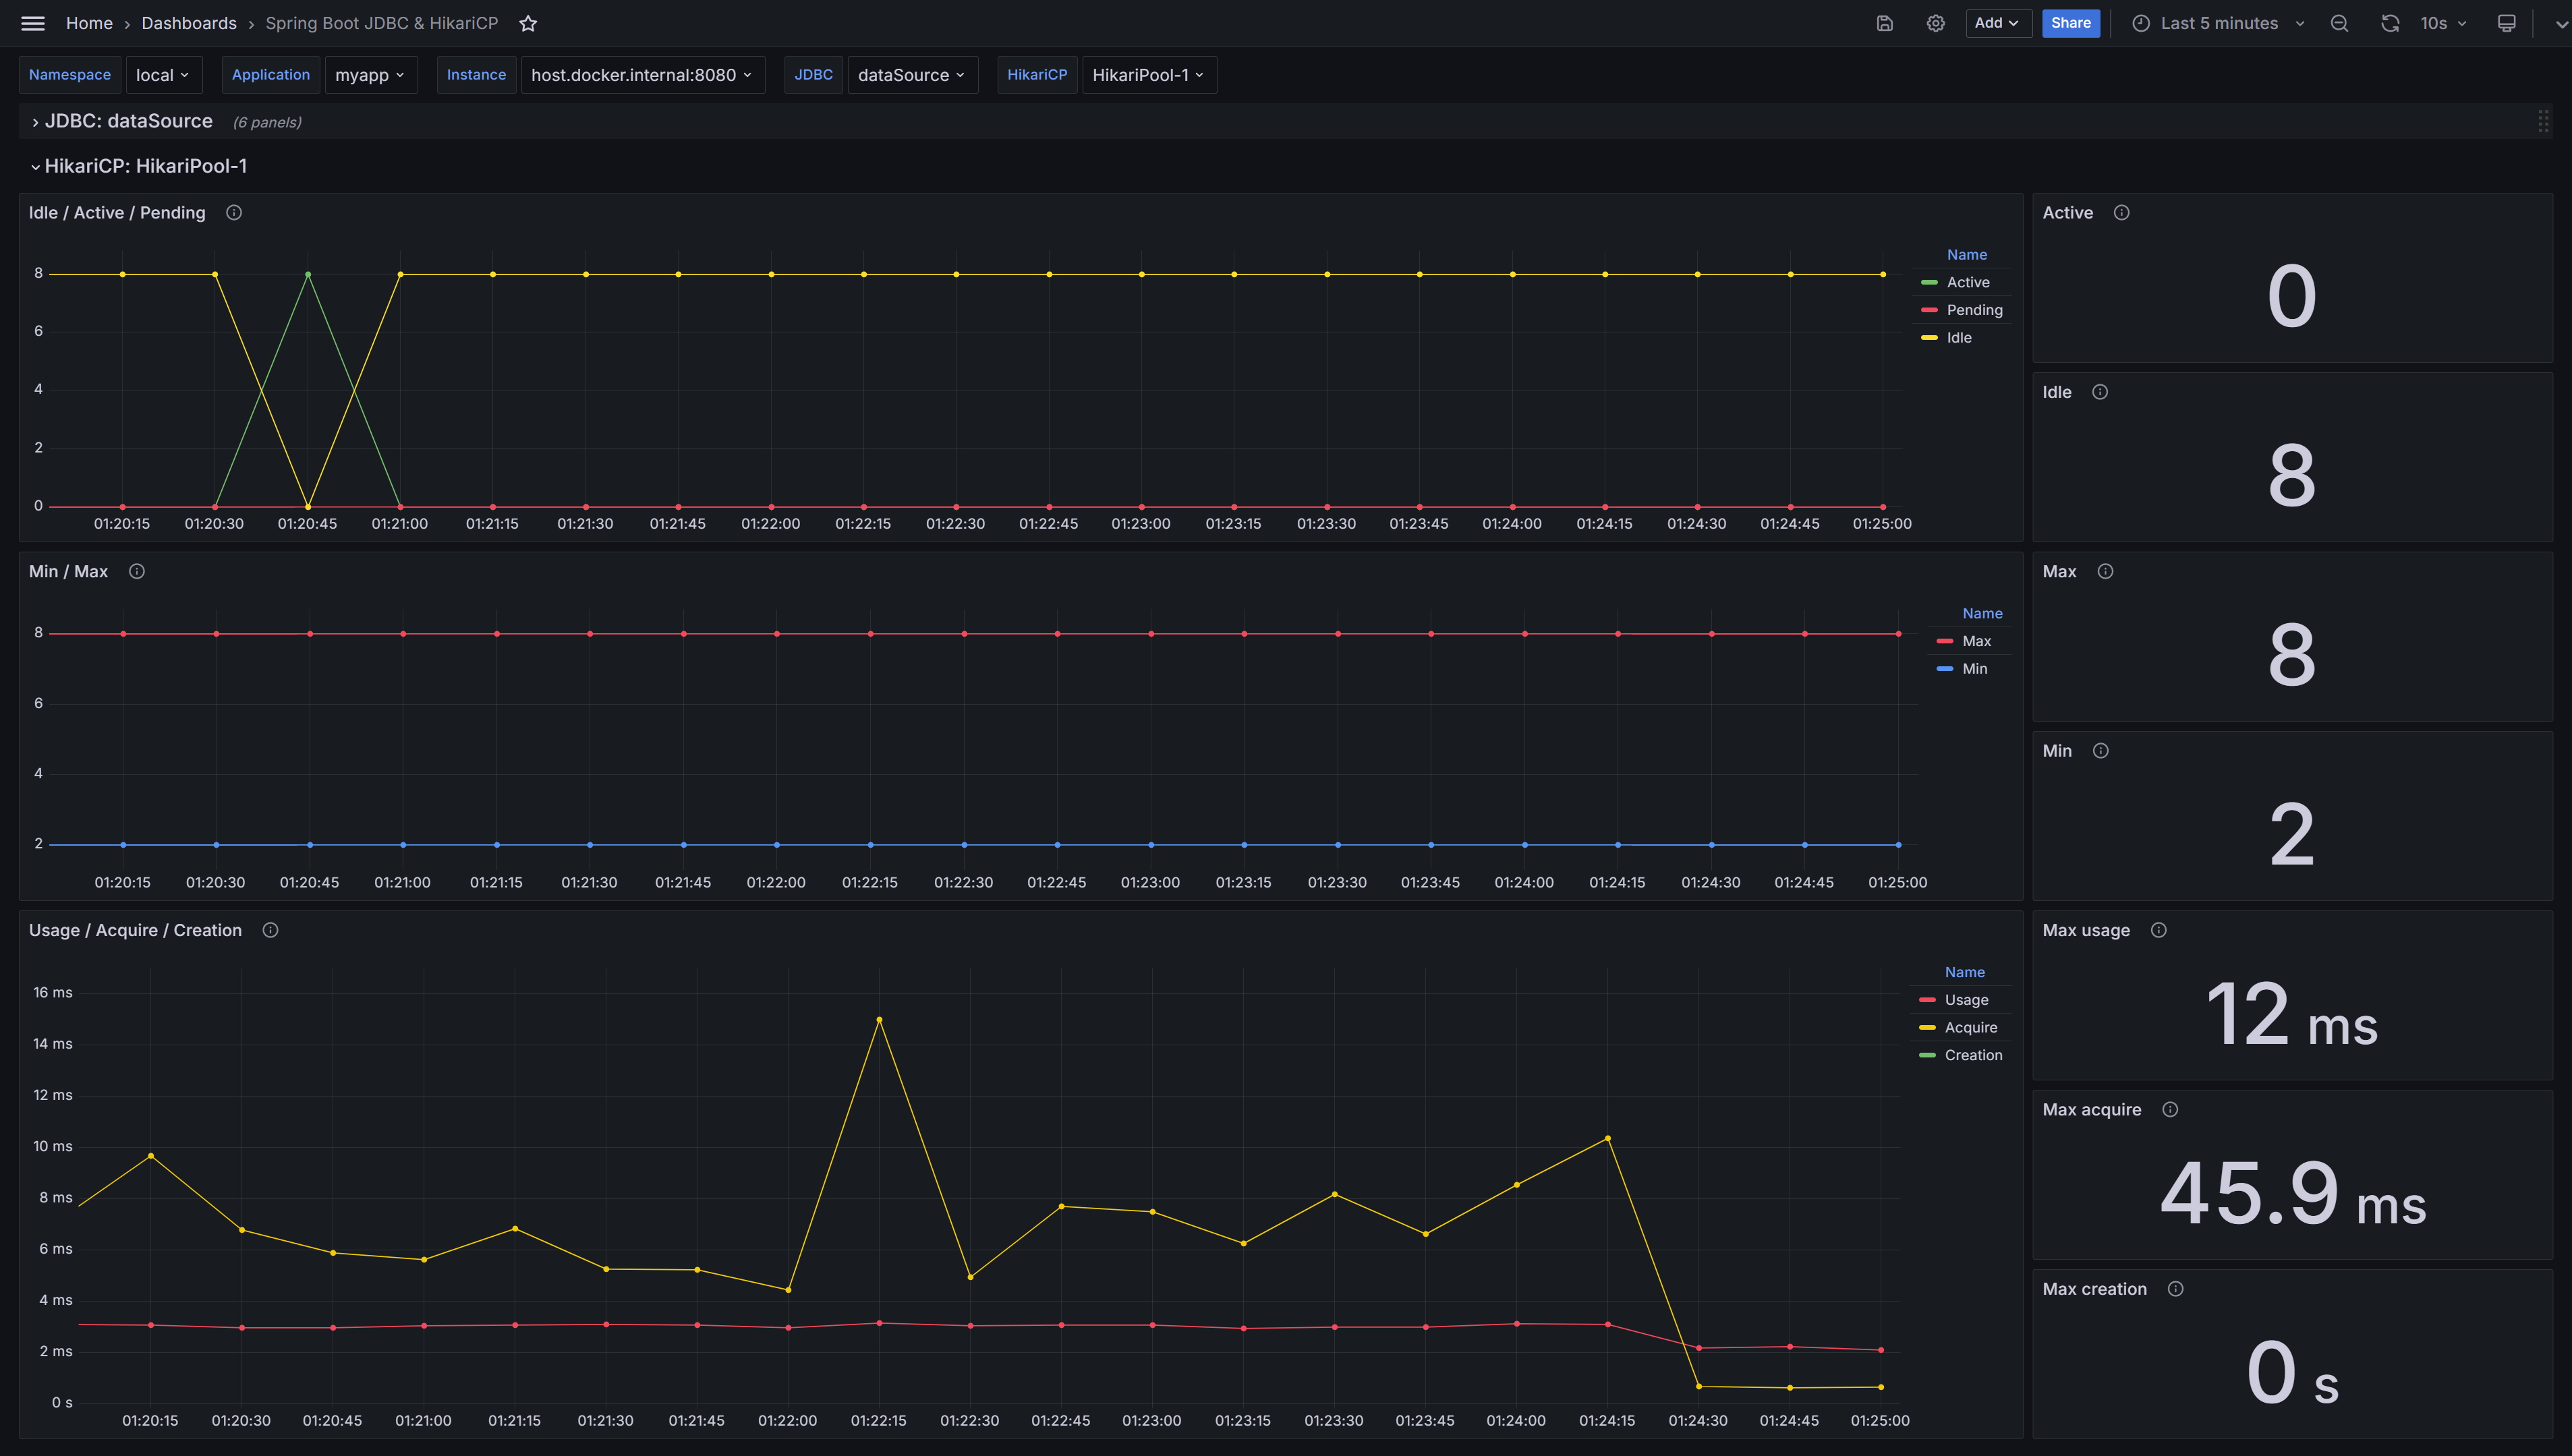
Spring Boot (Micrometer) with JDBC and HikariCP.
Screenshots
Get Dashboard✕
Download
Copy to Clipboard
Spring Boot (Micrometer) with JDBC and HikariCP.