Spring Boot Http (3.x) 5,1515,151
6/13/2024
6/13/2024
1
>=11.0.0
Prometheus
Description
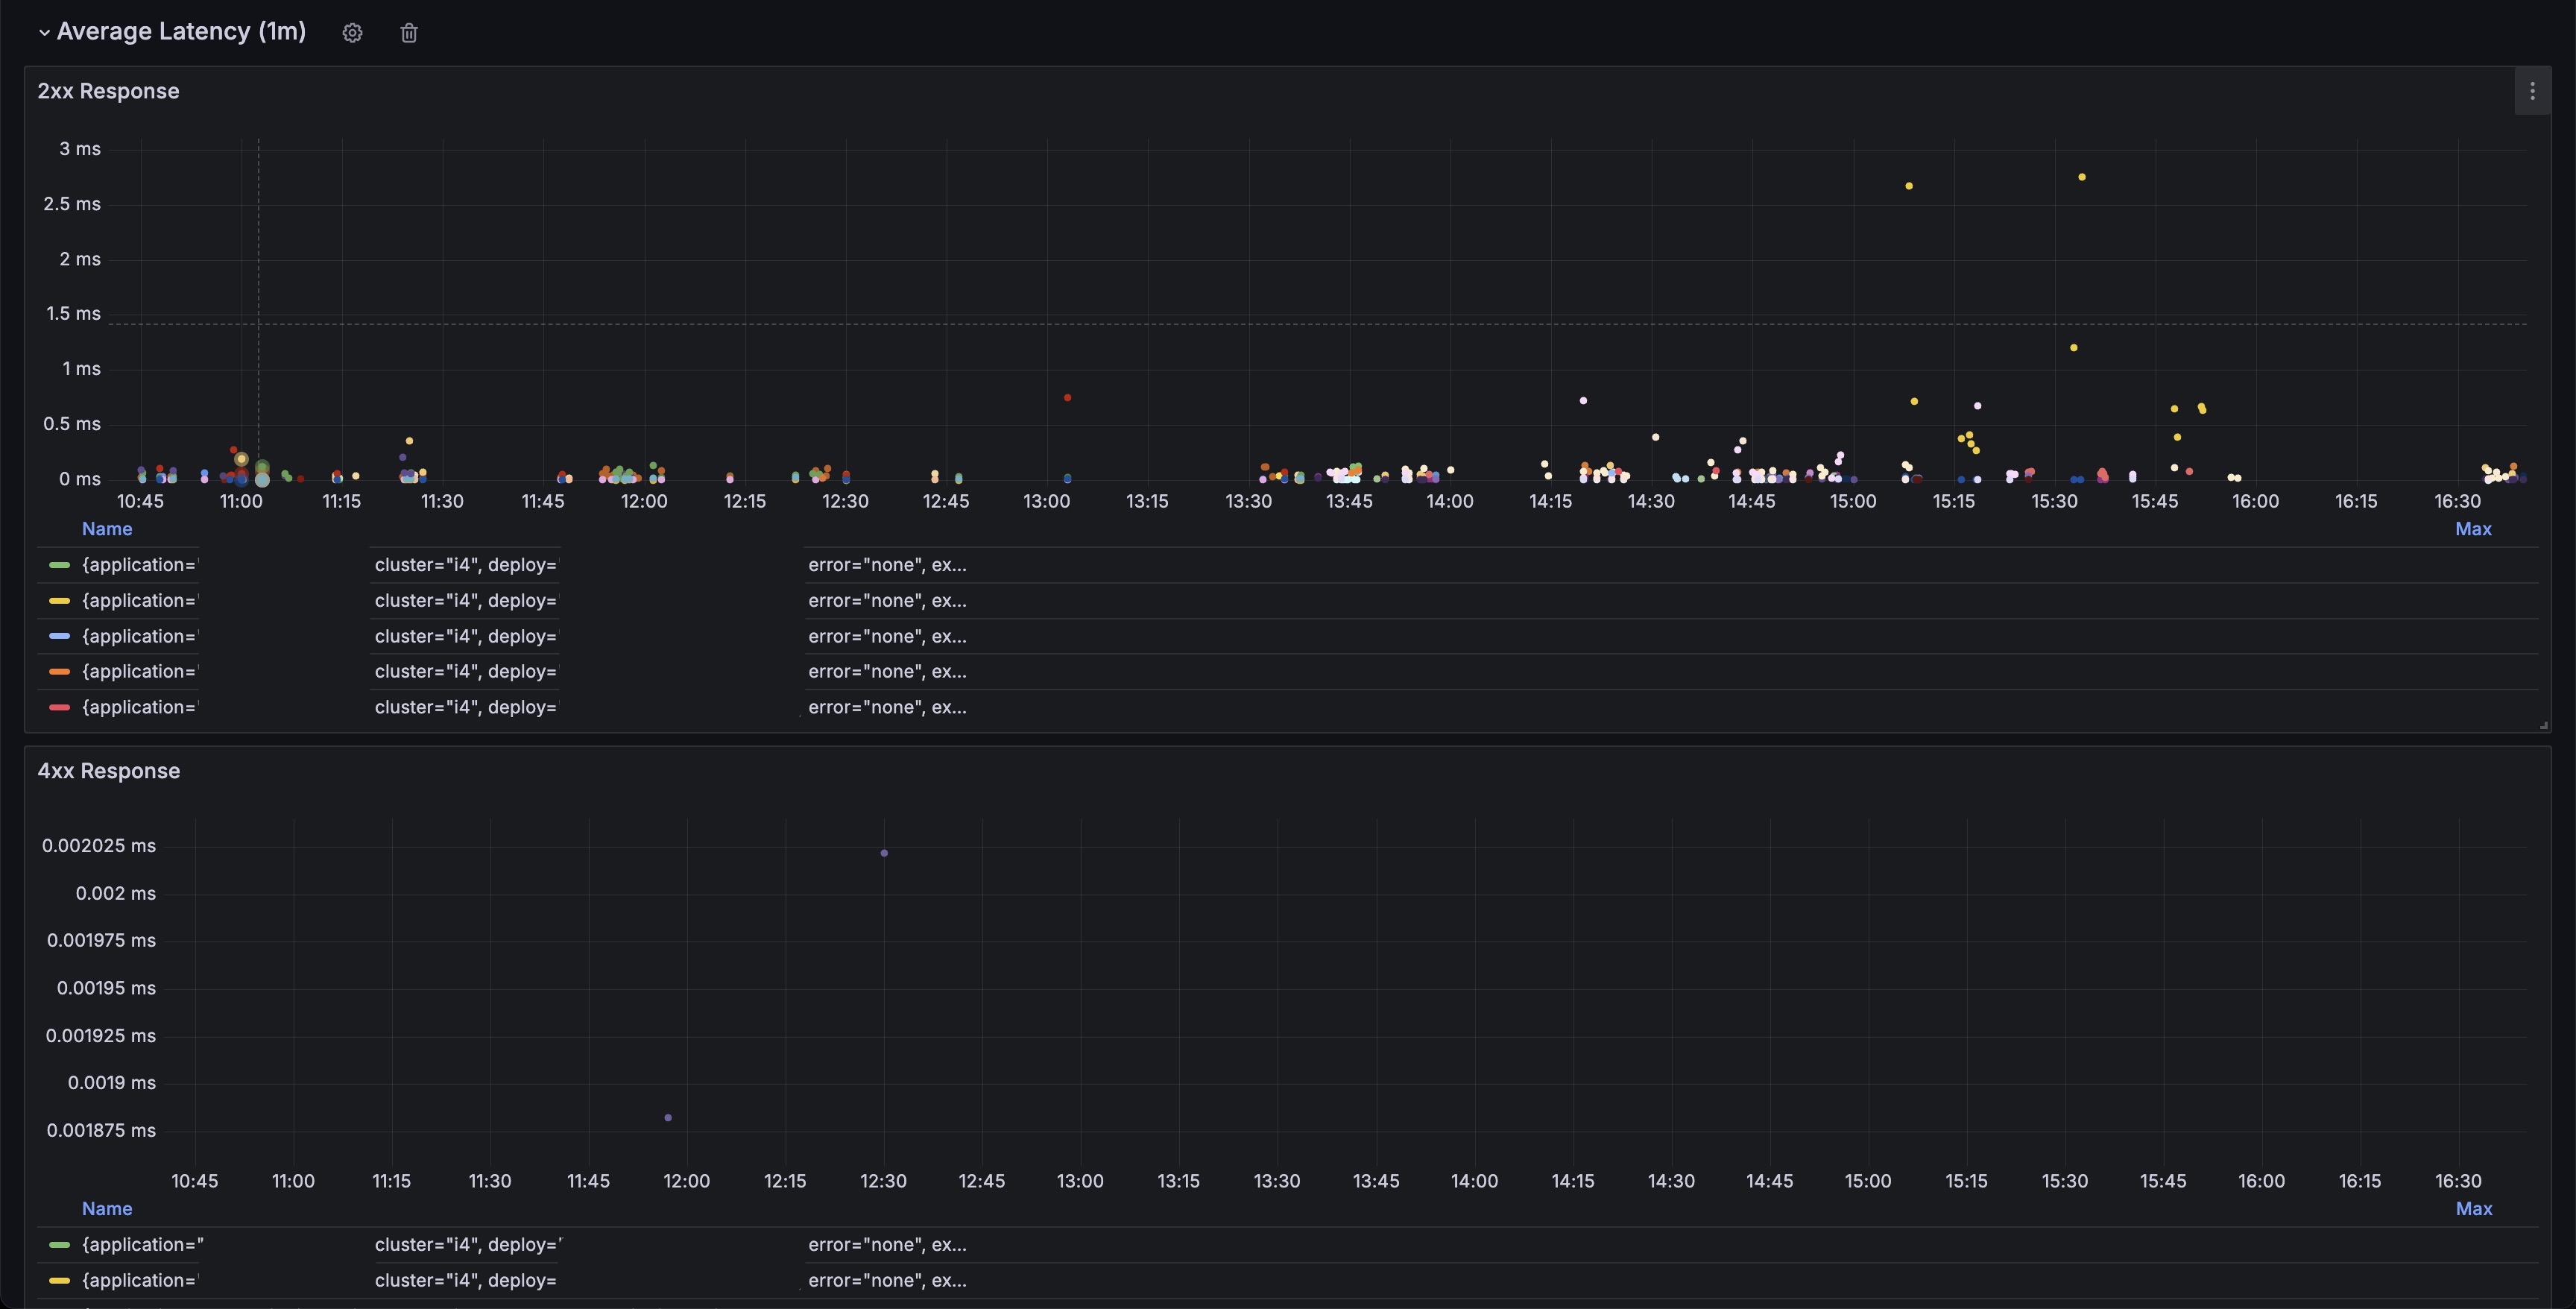
This dashboard provides real-time monitoring of HTTP requests in a Spring Boot application. It uses Spring Boot Actuator to expose metrics, Prometheus for data collection, and Grafana for visualization.
Screenshots
Get Dashboard✕
Download
Copy to Clipboard