Spring Boot HTTP 786786
4/1/2024
4/1/2024
1
Prometheus
Description
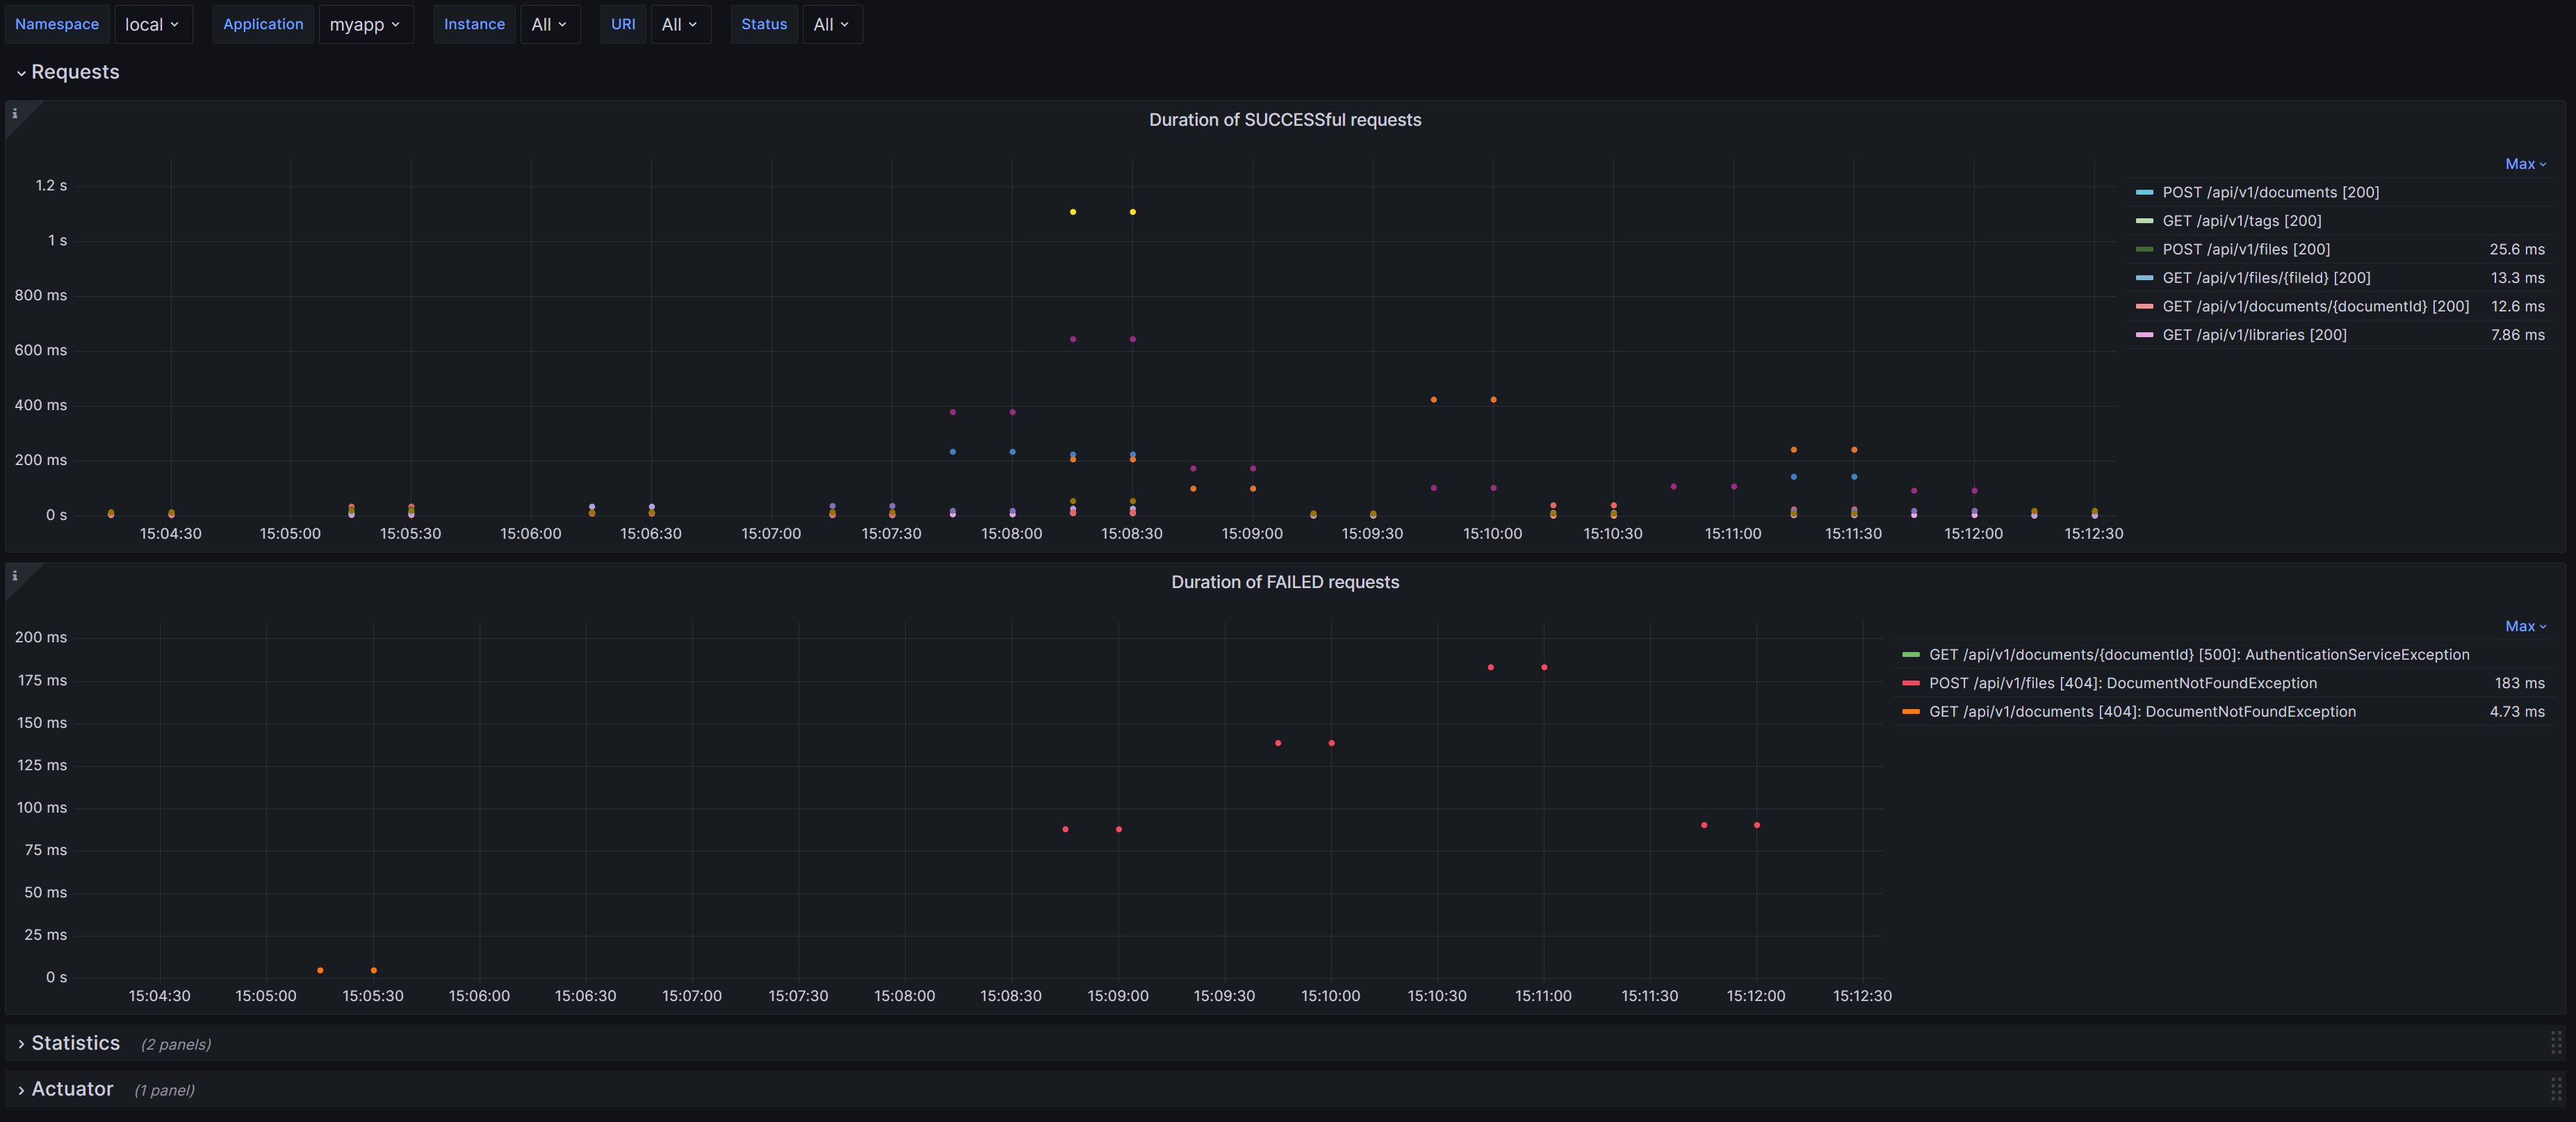
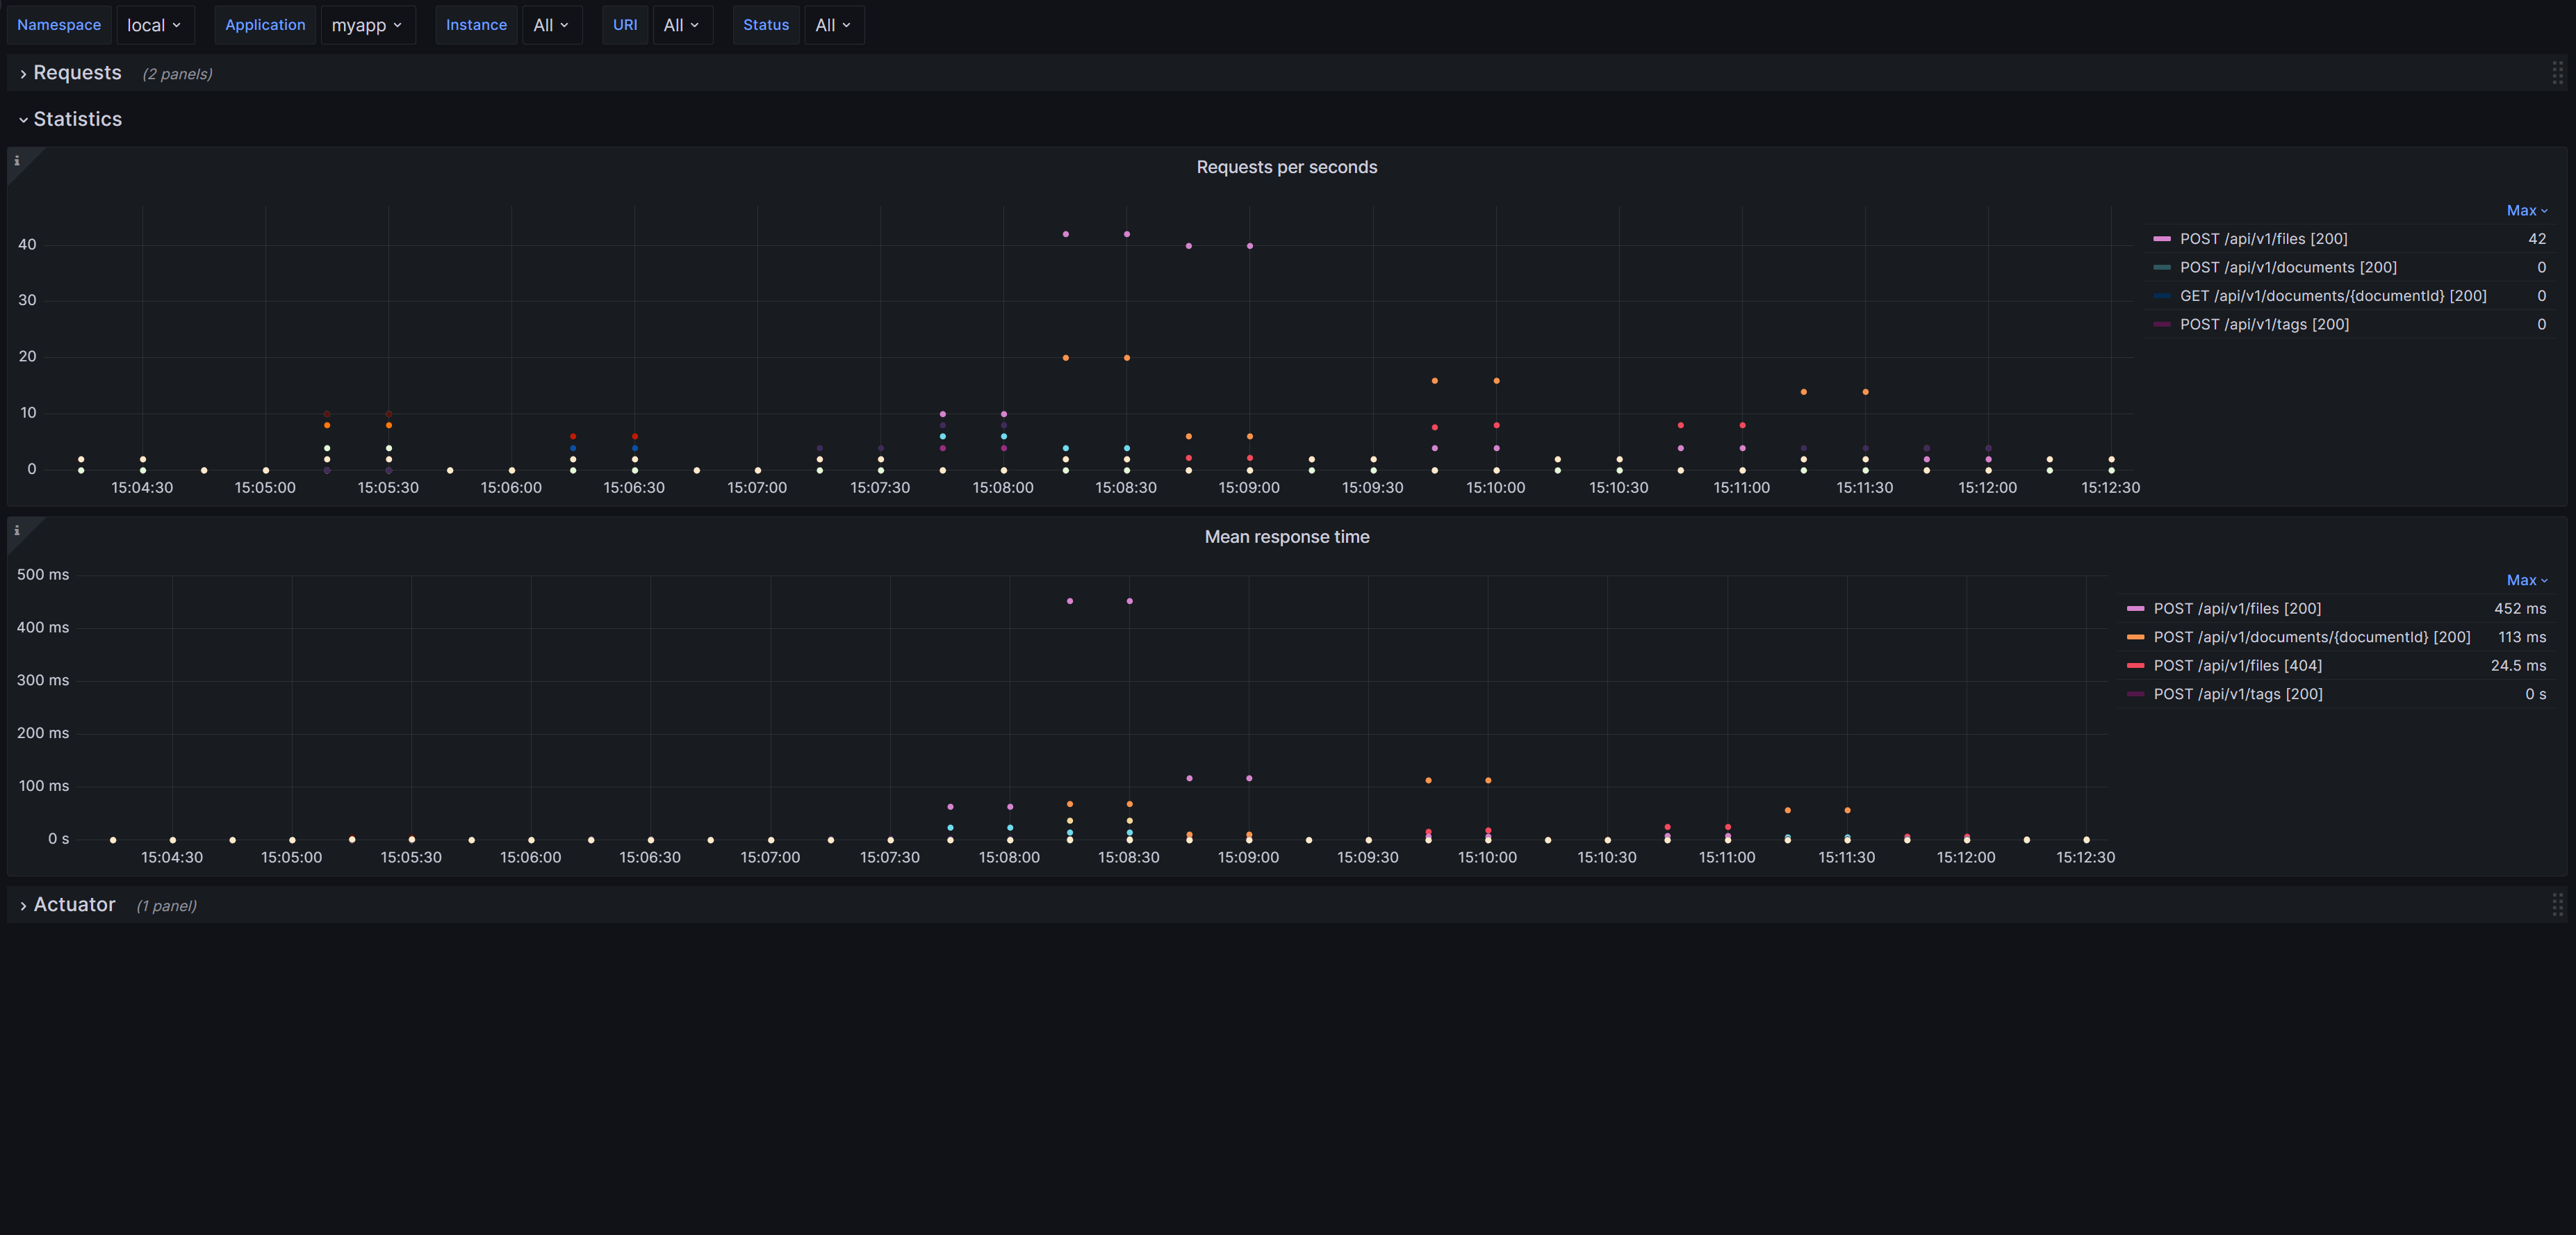
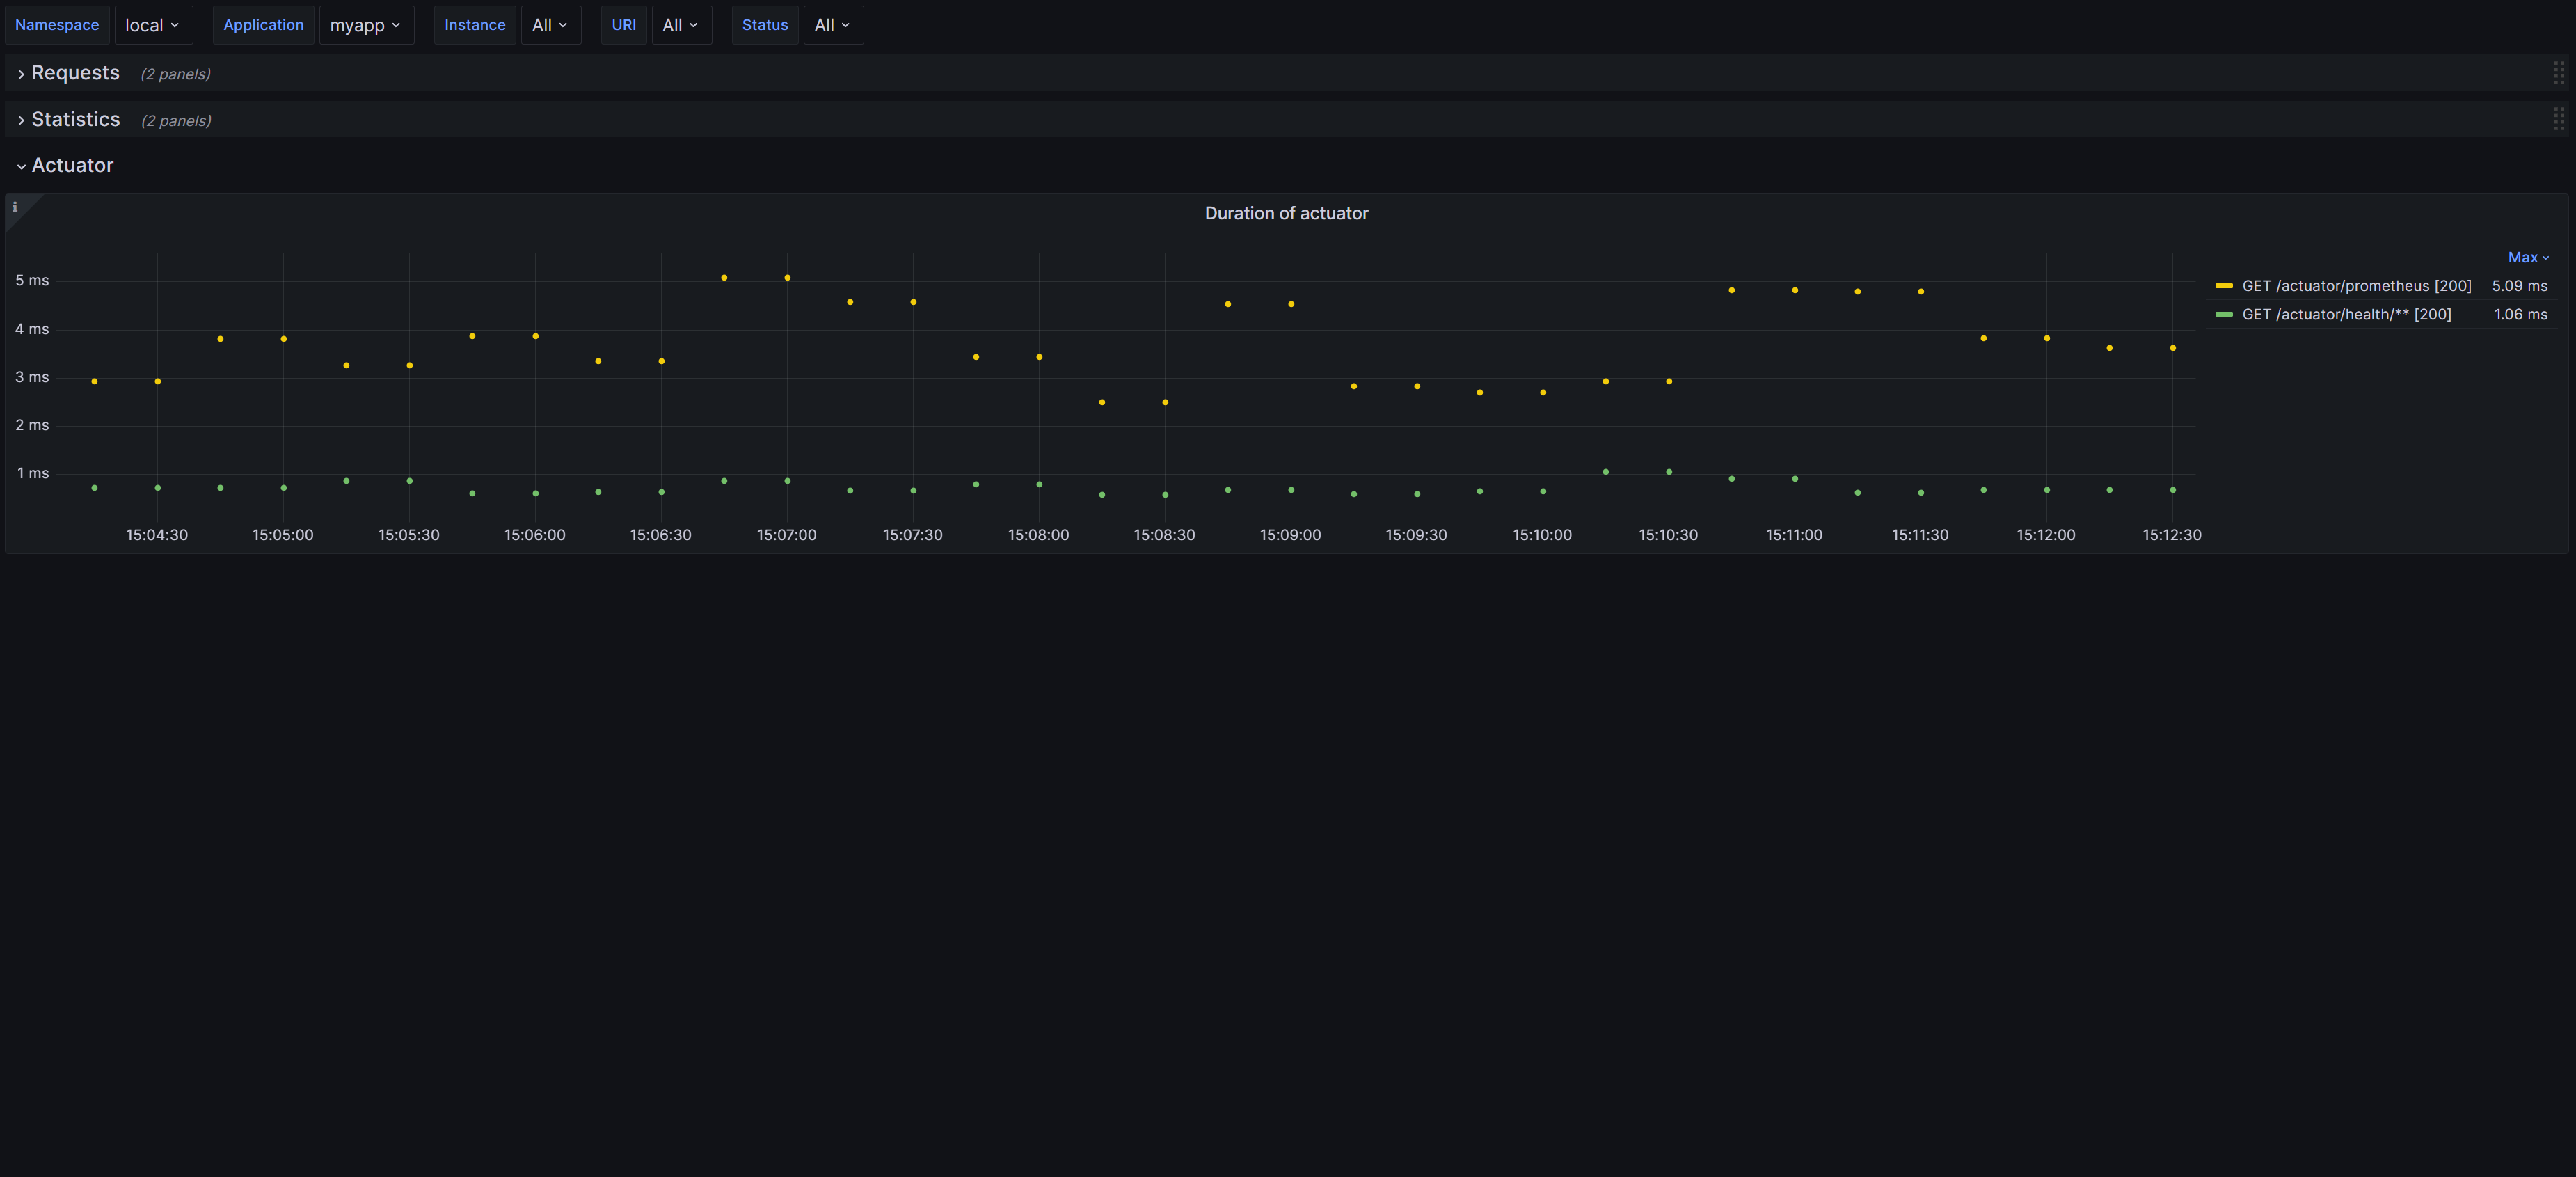
Spring Boot (Micrometer) with HTTP requests.
Screenshots
Used Metrics 22
http_server_requests_seconds_count
http_server_requests_seconds_sum
Get Dashboard✕
Download
Copy to Clipboard