Spring Boot HikariCP / JDBC 160,007160,007 3.7 (3 reviews)
Description
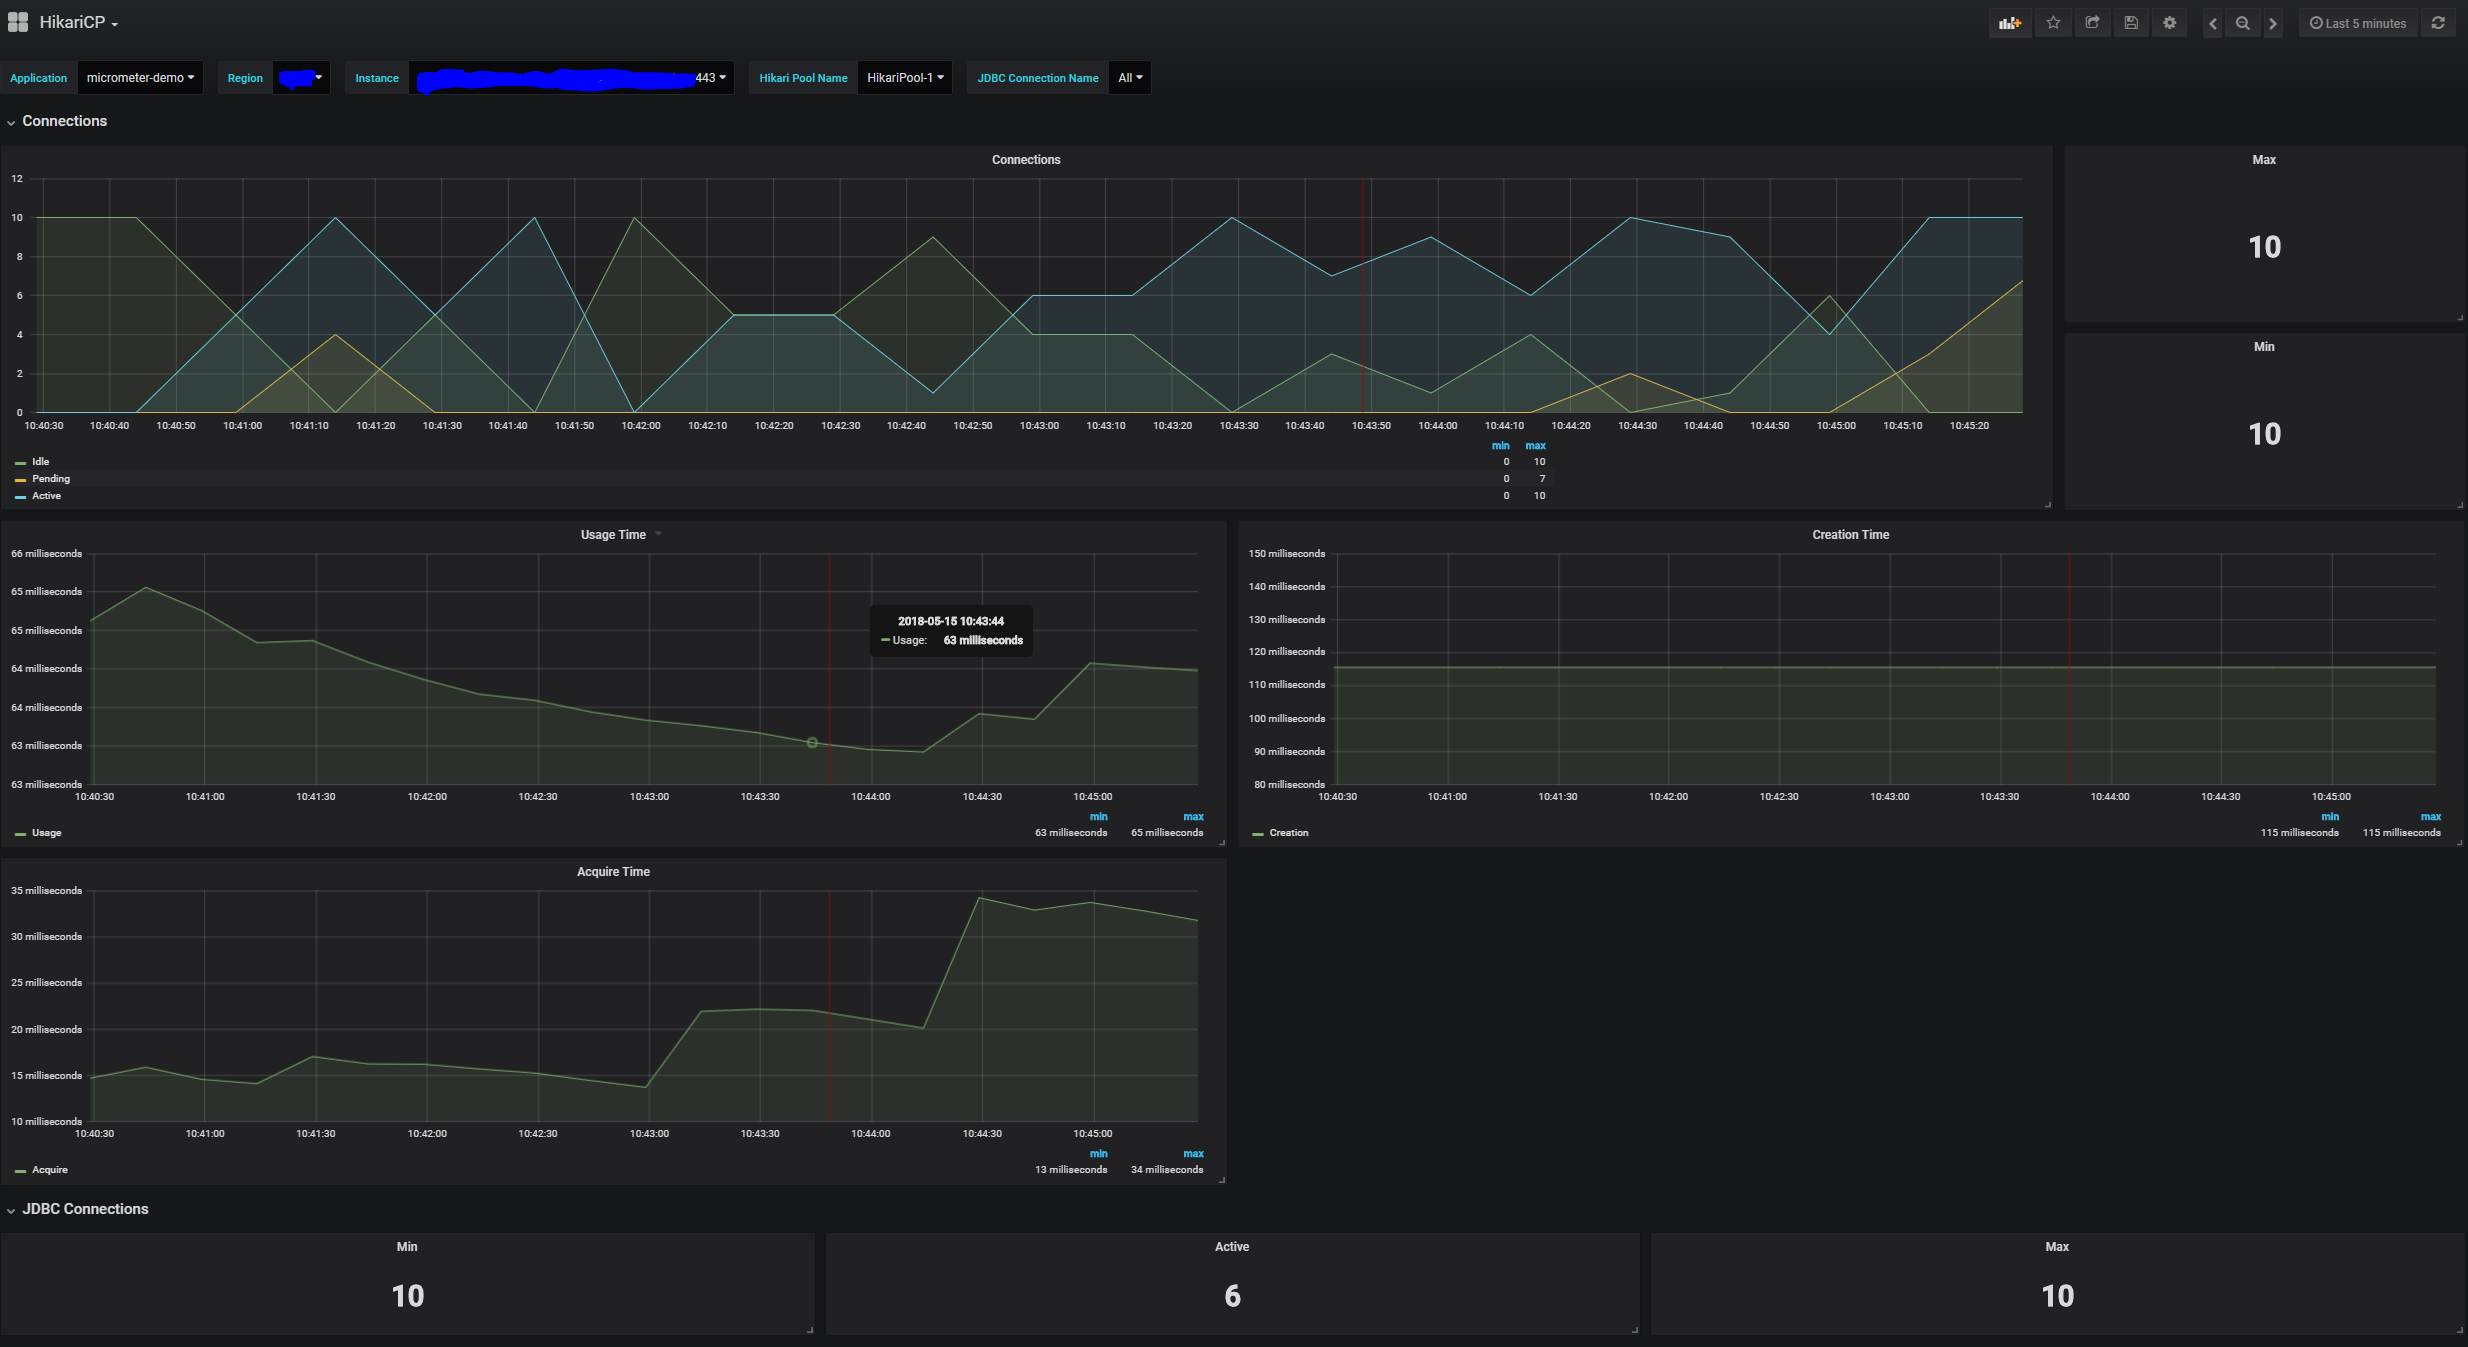
This dashboard monitors a Spring Boot application's JDBC and HikariCP connection usage and performance. It highlights key metrics such as jdbc_connections_min, jdbc_connections_active, and hikaricp_connections_timeout_total to show minimum/active connections, pool utilization, and timeout activity, enabling quick assessment of connection saturation and responsiveness. Panels track peak vs. idle/max/ongoing connections and total timeout events, supporting rapid troubleshooting of connection leaks or bottlenecks.
Screenshots
Used Metrics 1515
hikaricp_connections_acquire_seconds_count
hikaricp_connections_acquire_seconds_sum
hikaricp_connections_active
hikaricp_connections_creation_seconds_count
hikaricp_connections_creation_seconds_sum
hikaricp_connections_idle
hikaricp_connections_max
hikaricp_connections_min
hikaricp_connections_pending
hikaricp_connections_timeout_total
hikaricp_connections_usage_seconds_count
hikaricp_connections_usage_seconds_sum
jdbc_connections_active
jdbc_connections_max
jdbc_connections_min