Spring Boot Cache (3.x) 3,3293,329
6/12/2024
6/13/2024
1
Web Servers
>=11.0.0
Prometheus
Description
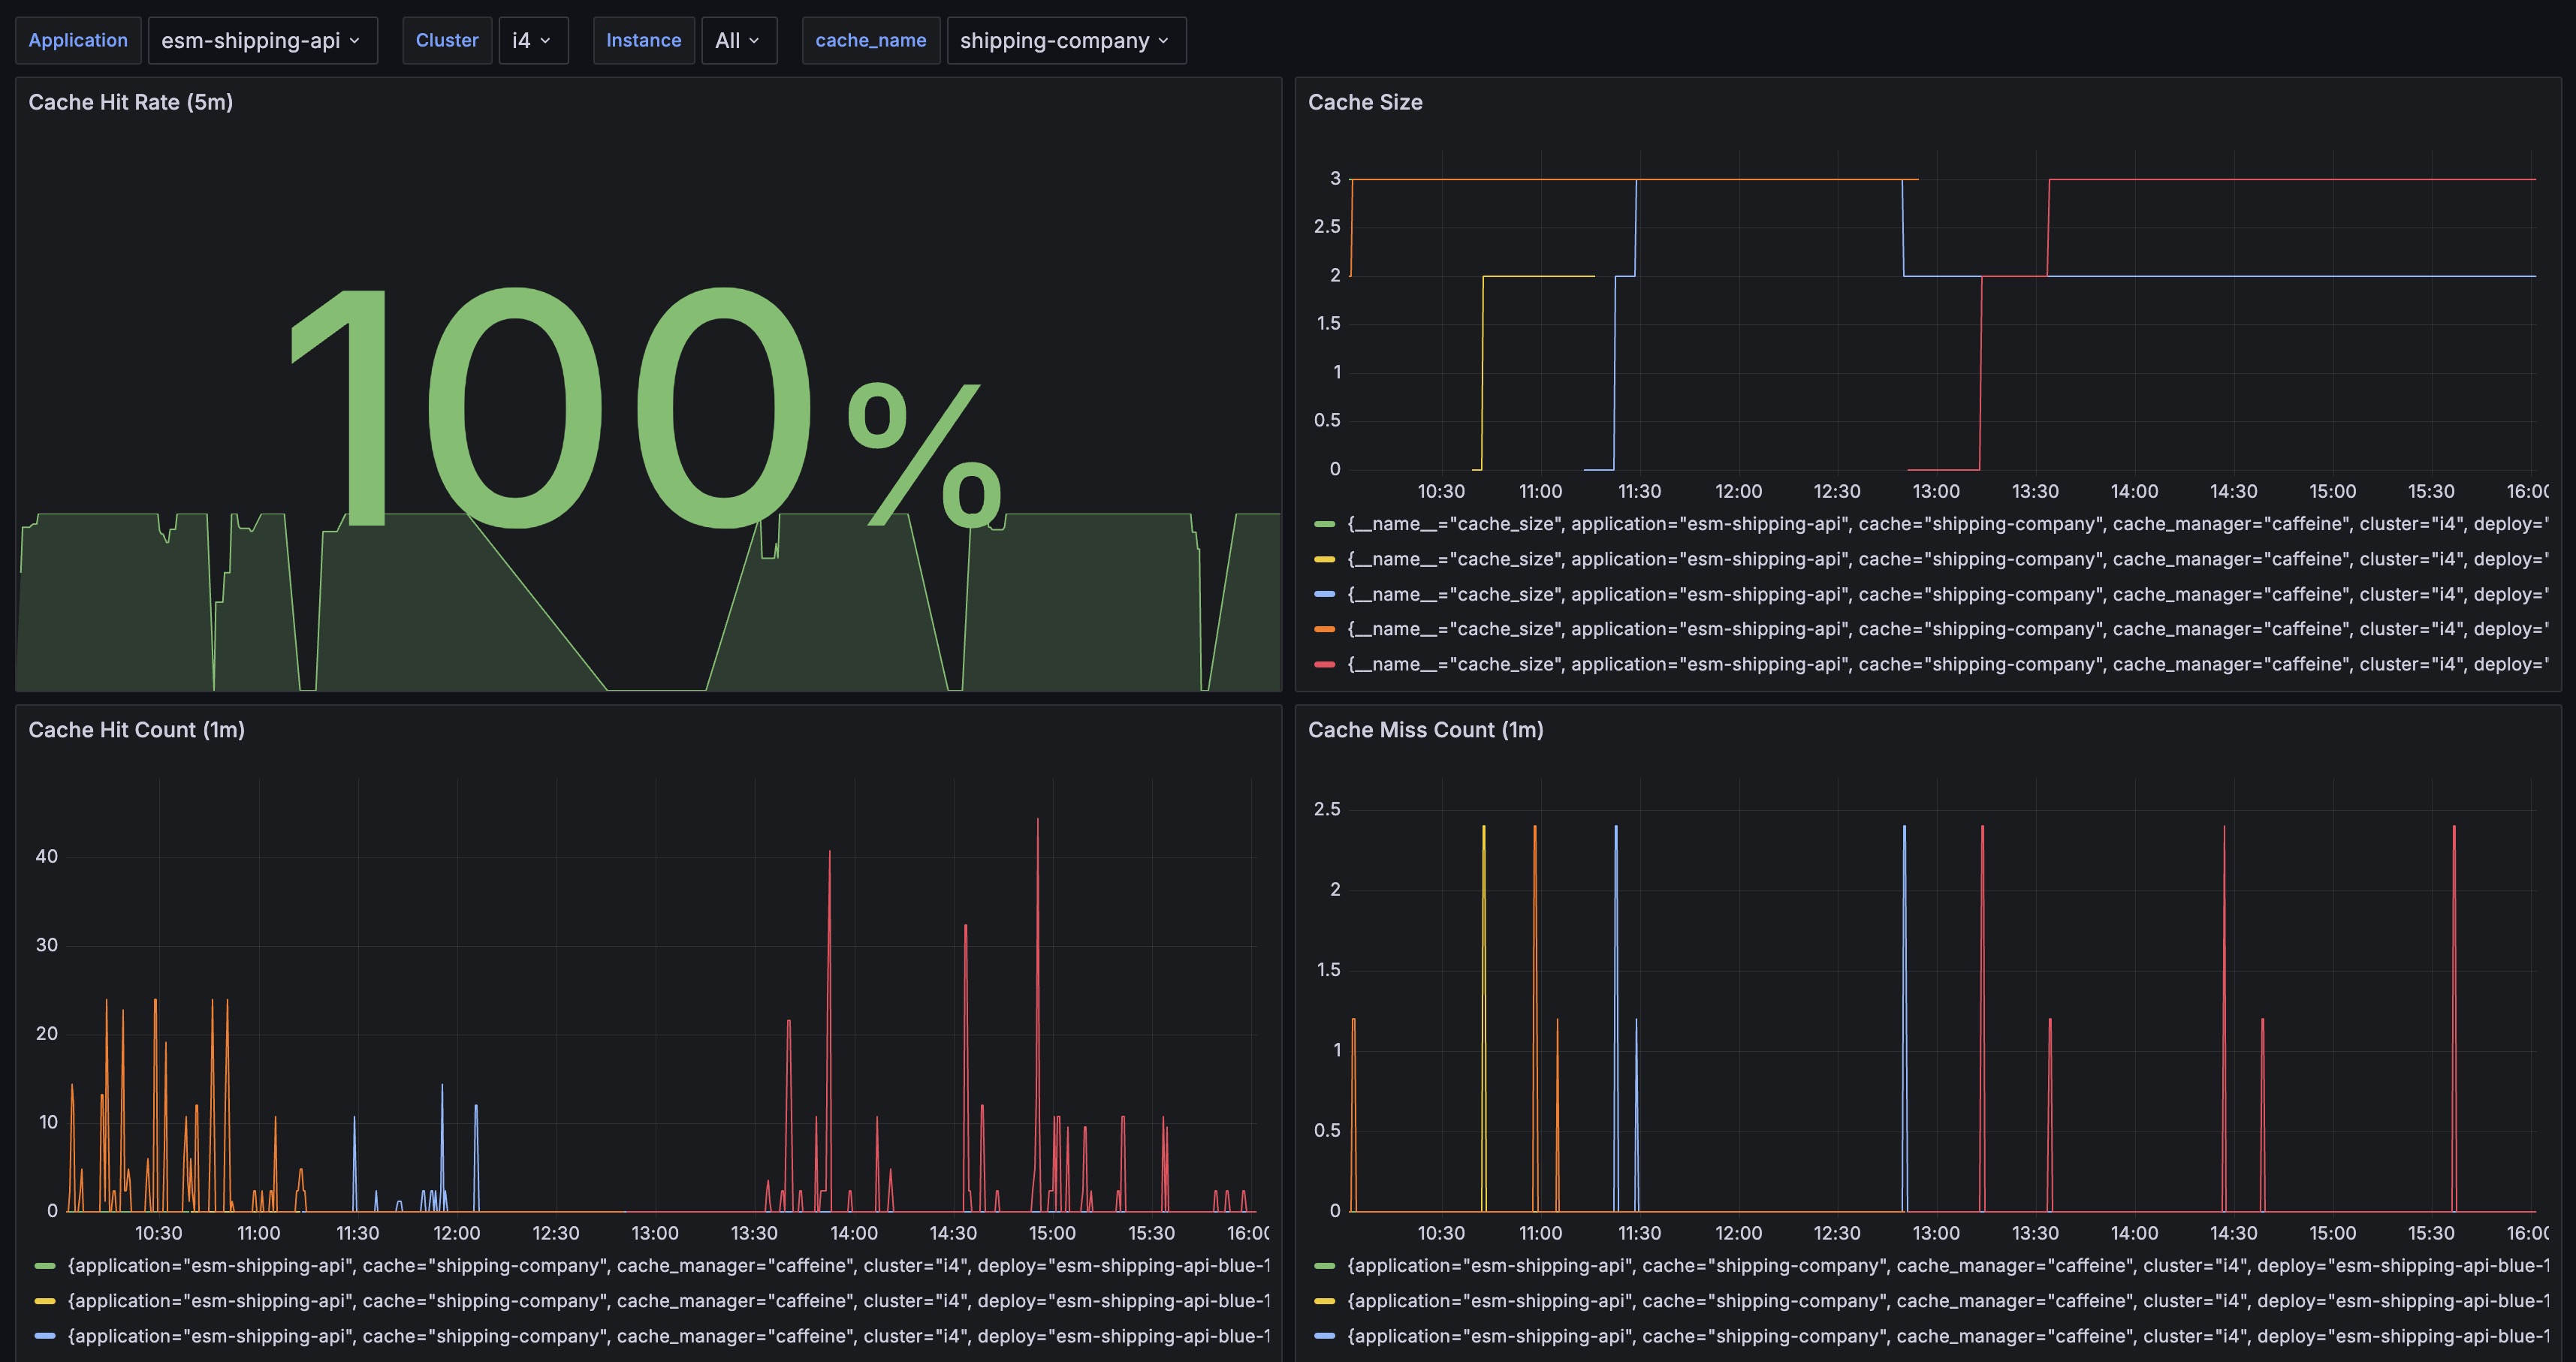
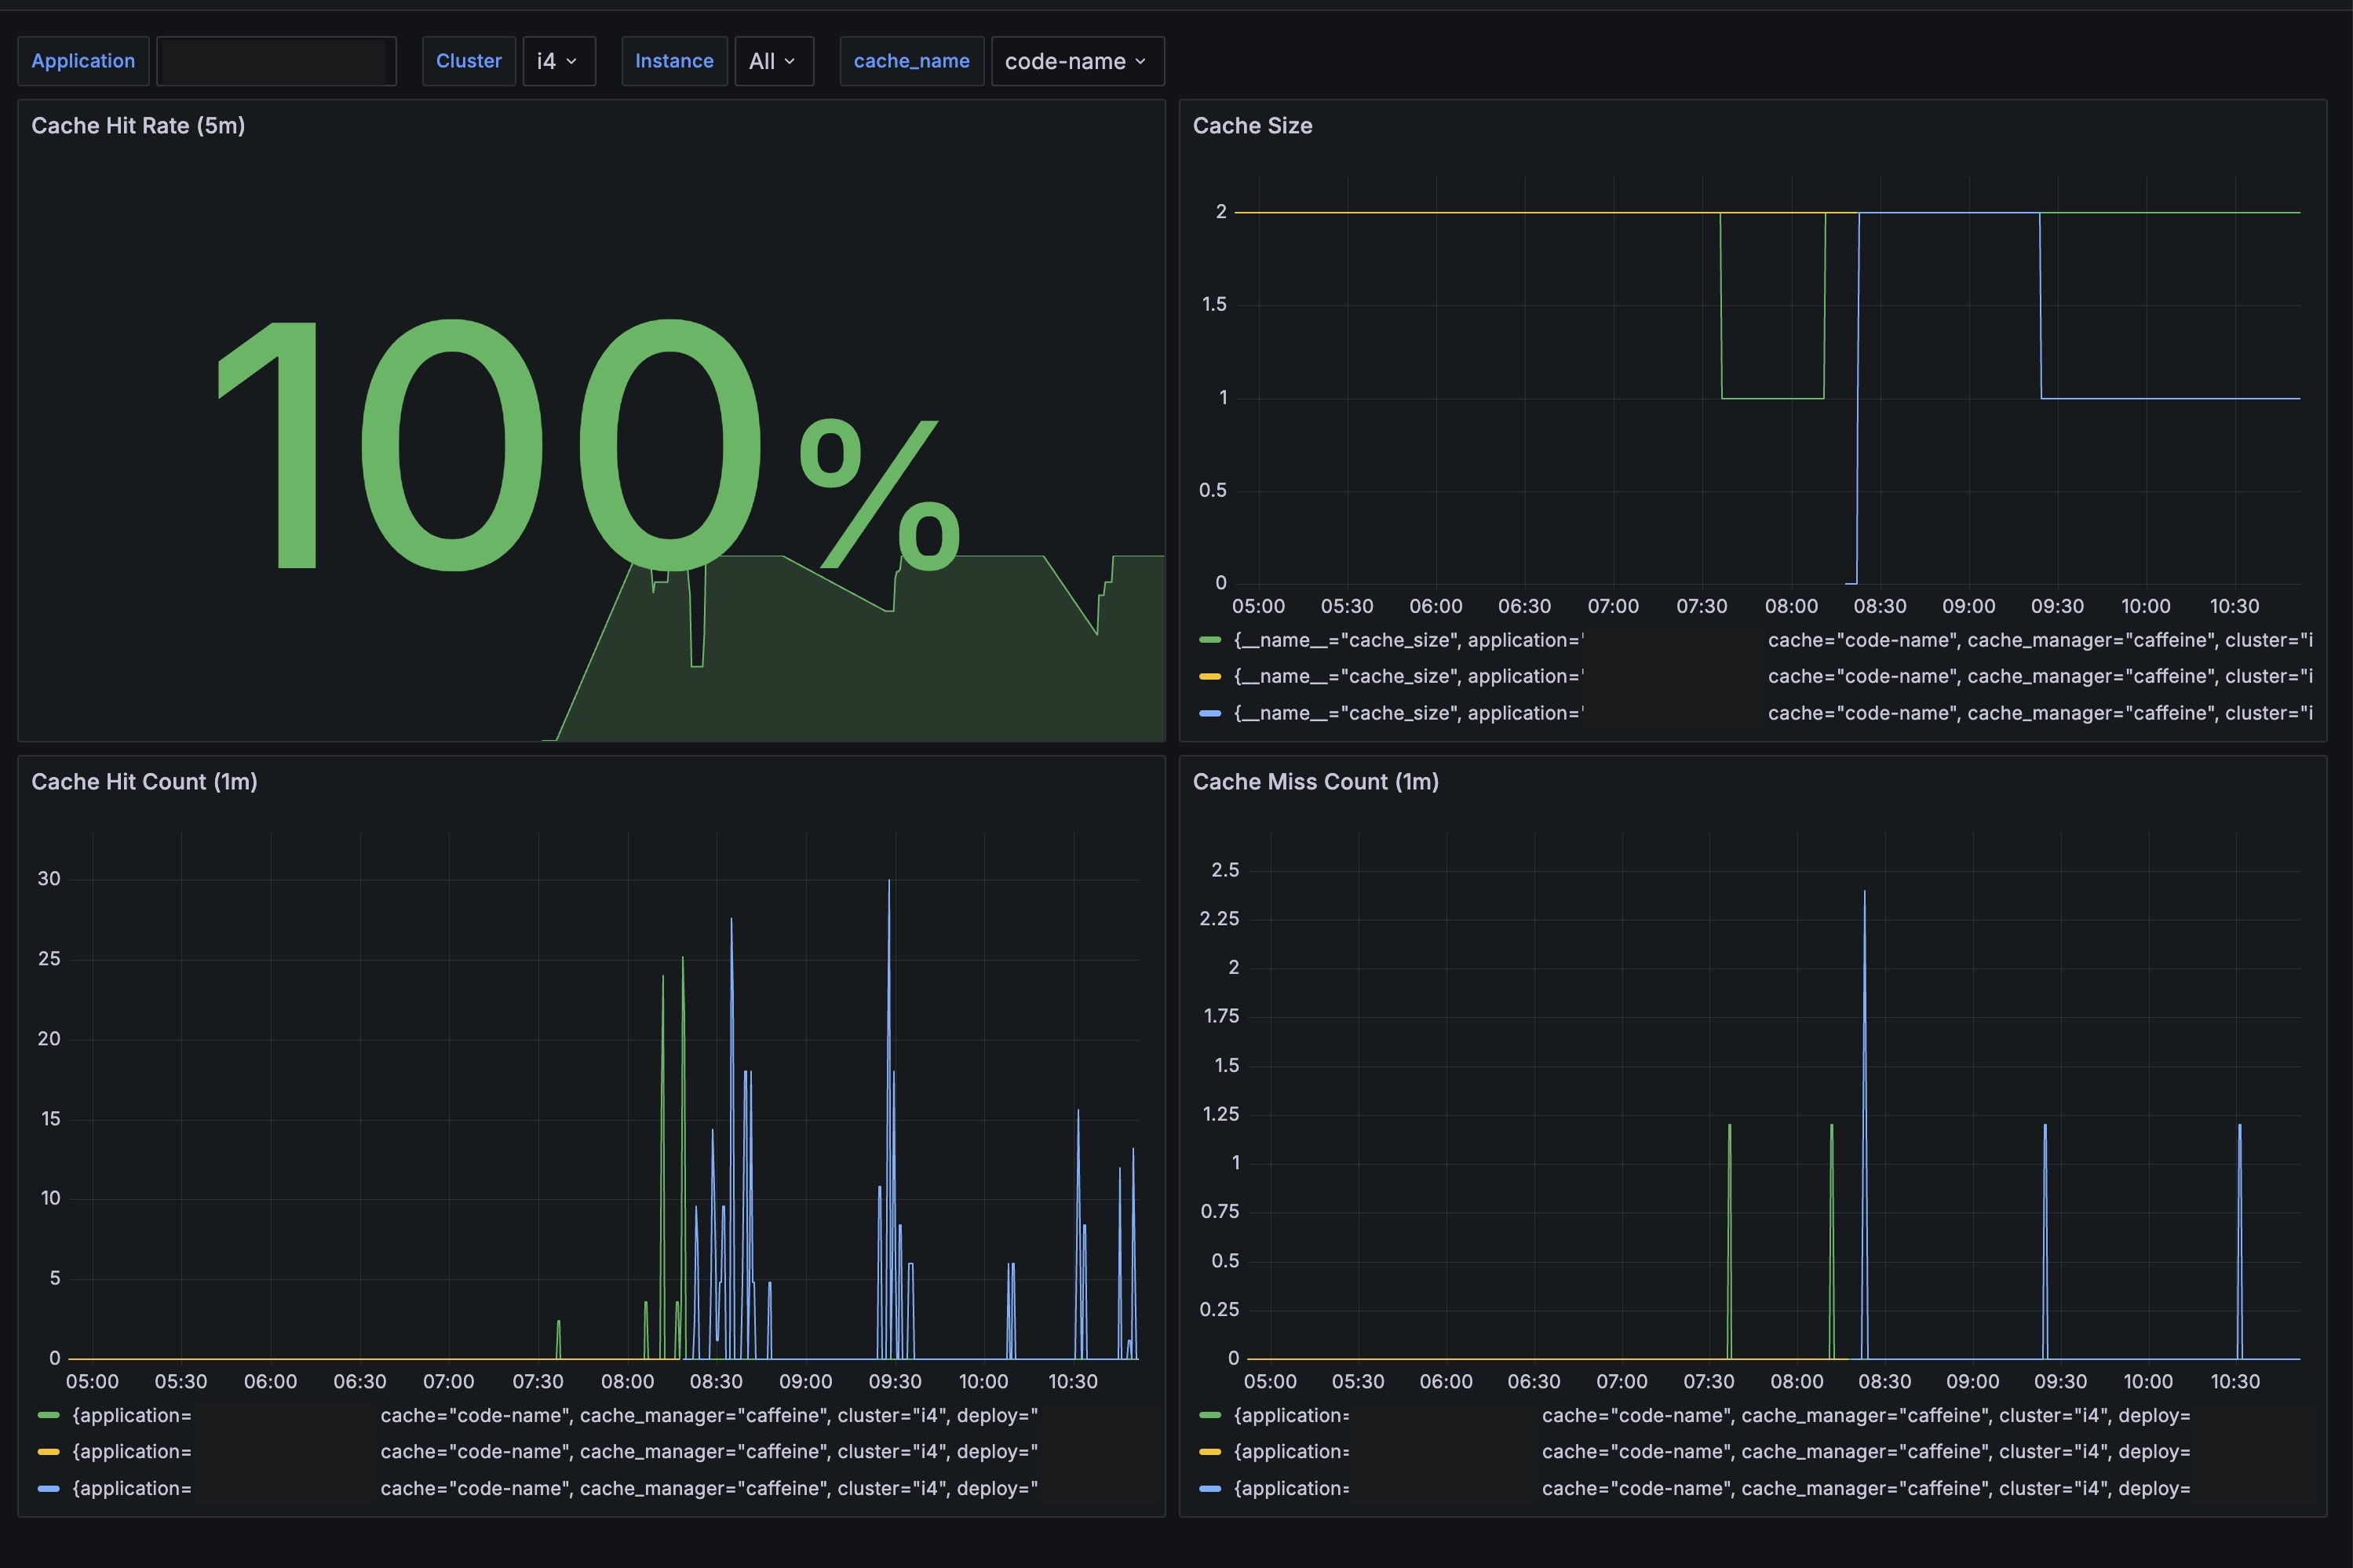
This dashboard provides real-time monitoring of cache performance and status in a Spring Boot application. It uses Spring Boot Actuator to expose metrics, Prometheus for data collection, and Grafana for visualization.
Screenshots
Used Metrics 22
cache_gets_total
cache_size
Get Dashboard✕
Download
Copy to Clipboard