Spring Boot 2.1 System Monitor 5,788,3575,788,357 4.3 (3 reviews)
Description
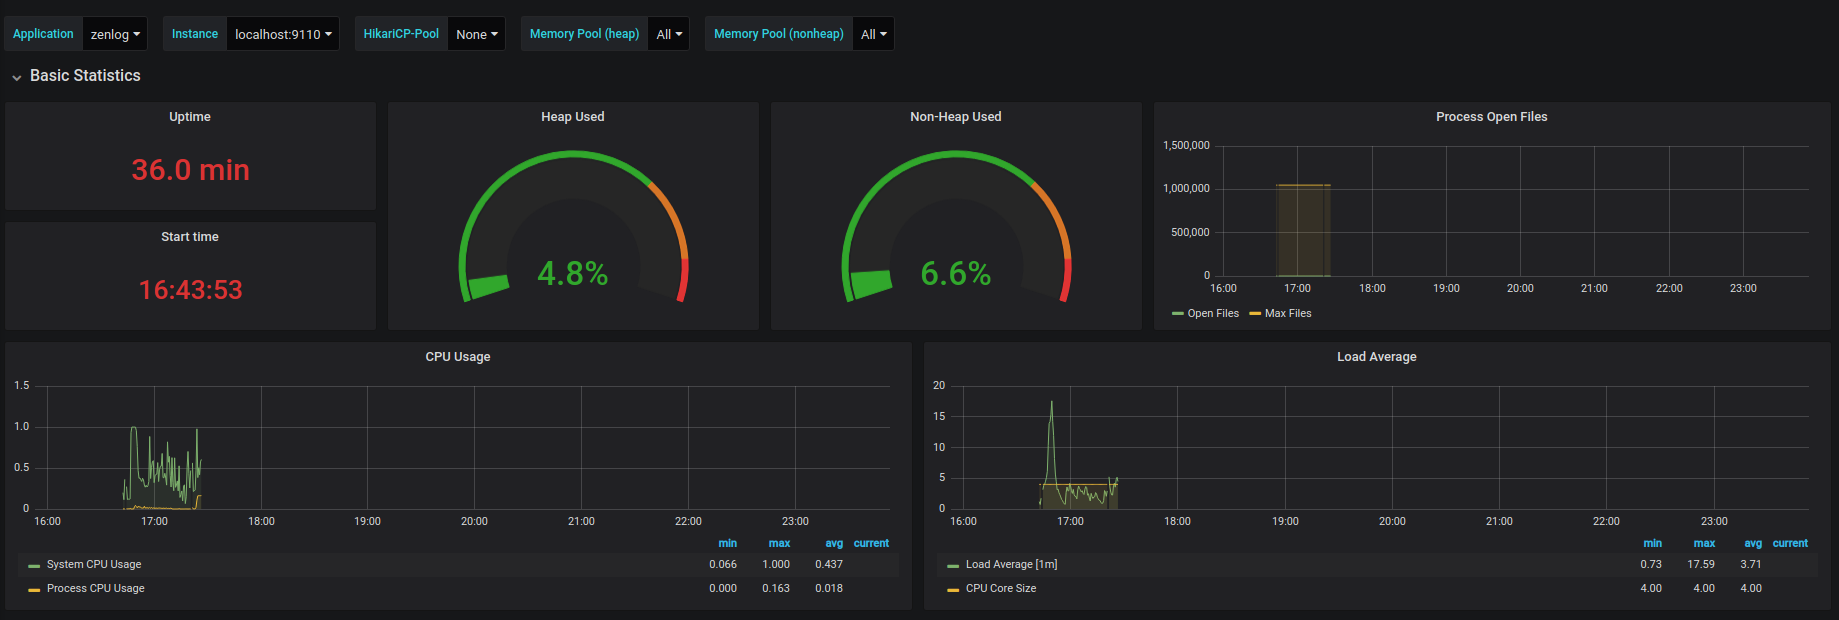
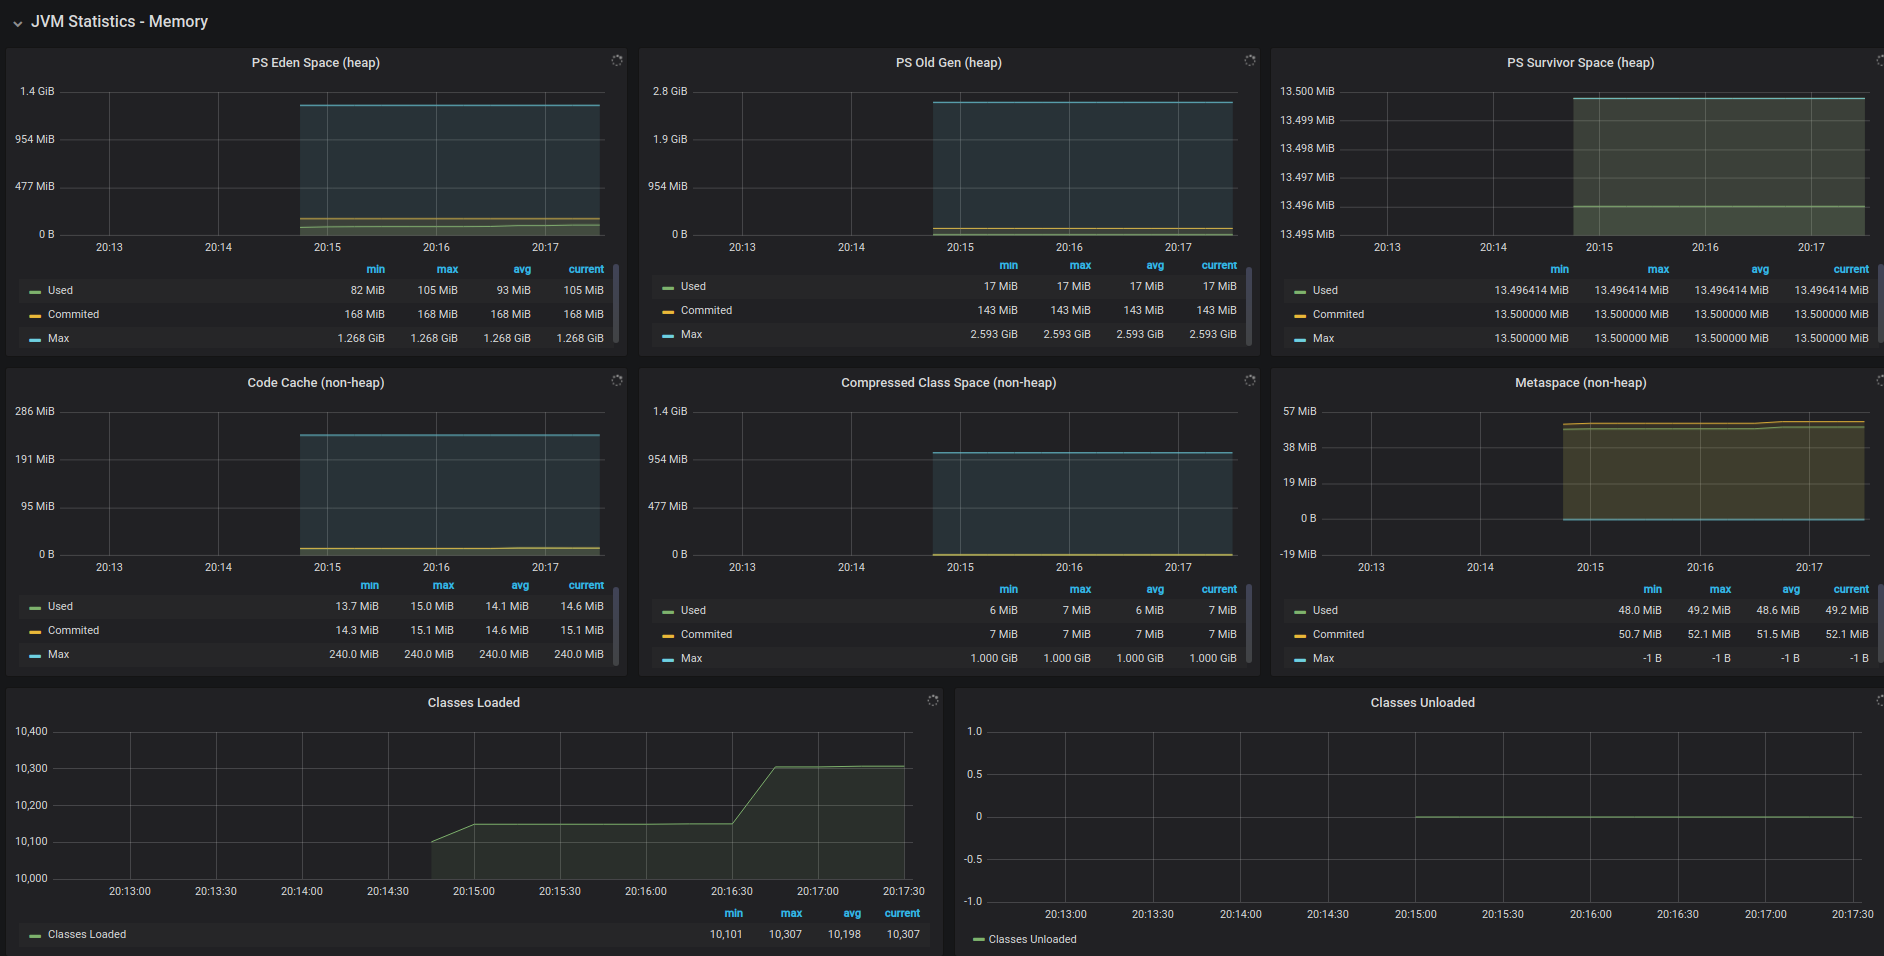
This dashboard provides a telemetry view of a Spring Boot 2.1 application's runtime and JVM health, tracking both system and JVM metrics to help identify resource pressure and performance bottlenecks. Key metrics include process_uptime_seconds, jvm_memory_used_bytes, and system_cpu_usage, enabling quick assessment of runtime continuity, heap/non-heap memory usage, and CPU load, while panels for Process Open Files, Threads, and GC metrics offer deeper dive points for resource contention and garbage collection behavior.
Screenshots
Used Metrics 4444
hikaricp_connections
hikaricp_connections_acquire_seconds_count
hikaricp_connections_acquire_seconds_sum
hikaricp_connections_active
hikaricp_connections_creation_seconds_count
hikaricp_connections_creation_seconds_sum
hikaricp_connections_idle
hikaricp_connections_pending
hikaricp_connections_timeout_total
hikaricp_connections_usage_seconds_count
hikaricp_connections_usage_seconds_sum
http_server_requests_seconds_count
http_server_requests_seconds_max
http_server_requests_seconds_sum
jetty_threads_busy
jetty_threads_config_max
jetty_threads_config_min
jetty_threads_current
jetty_threads_idle
jetty_threads_jobs
jvm_buffer_memory_used_bytes
jvm_buffer_total_capacity_bytes
jvm_classes_loaded_classes
jvm_classes_unloaded_classes_total
jvm_gc_memory_allocated_bytes_total
jvm_gc_memory_promoted_bytes_total
jvm_gc_pause_seconds_count
jvm_gc_pause_seconds_sum
jvm_memory_committed_bytes
jvm_memory_max_bytes
jvm_memory_used_bytes
jvm_threads_daemon_threads
jvm_threads_live_threads
jvm_threads_peak_threads
logback_events_total
process_cpu_usage
process_files_max_files
process_files_open_files
-
process_start_time_seconds
process_uptime_seconds
system_cpu_count
system_cpu_usage
system_load_average_
topk