Spegel stateless cluster local OCI registry mirror 238,129238,129
Description
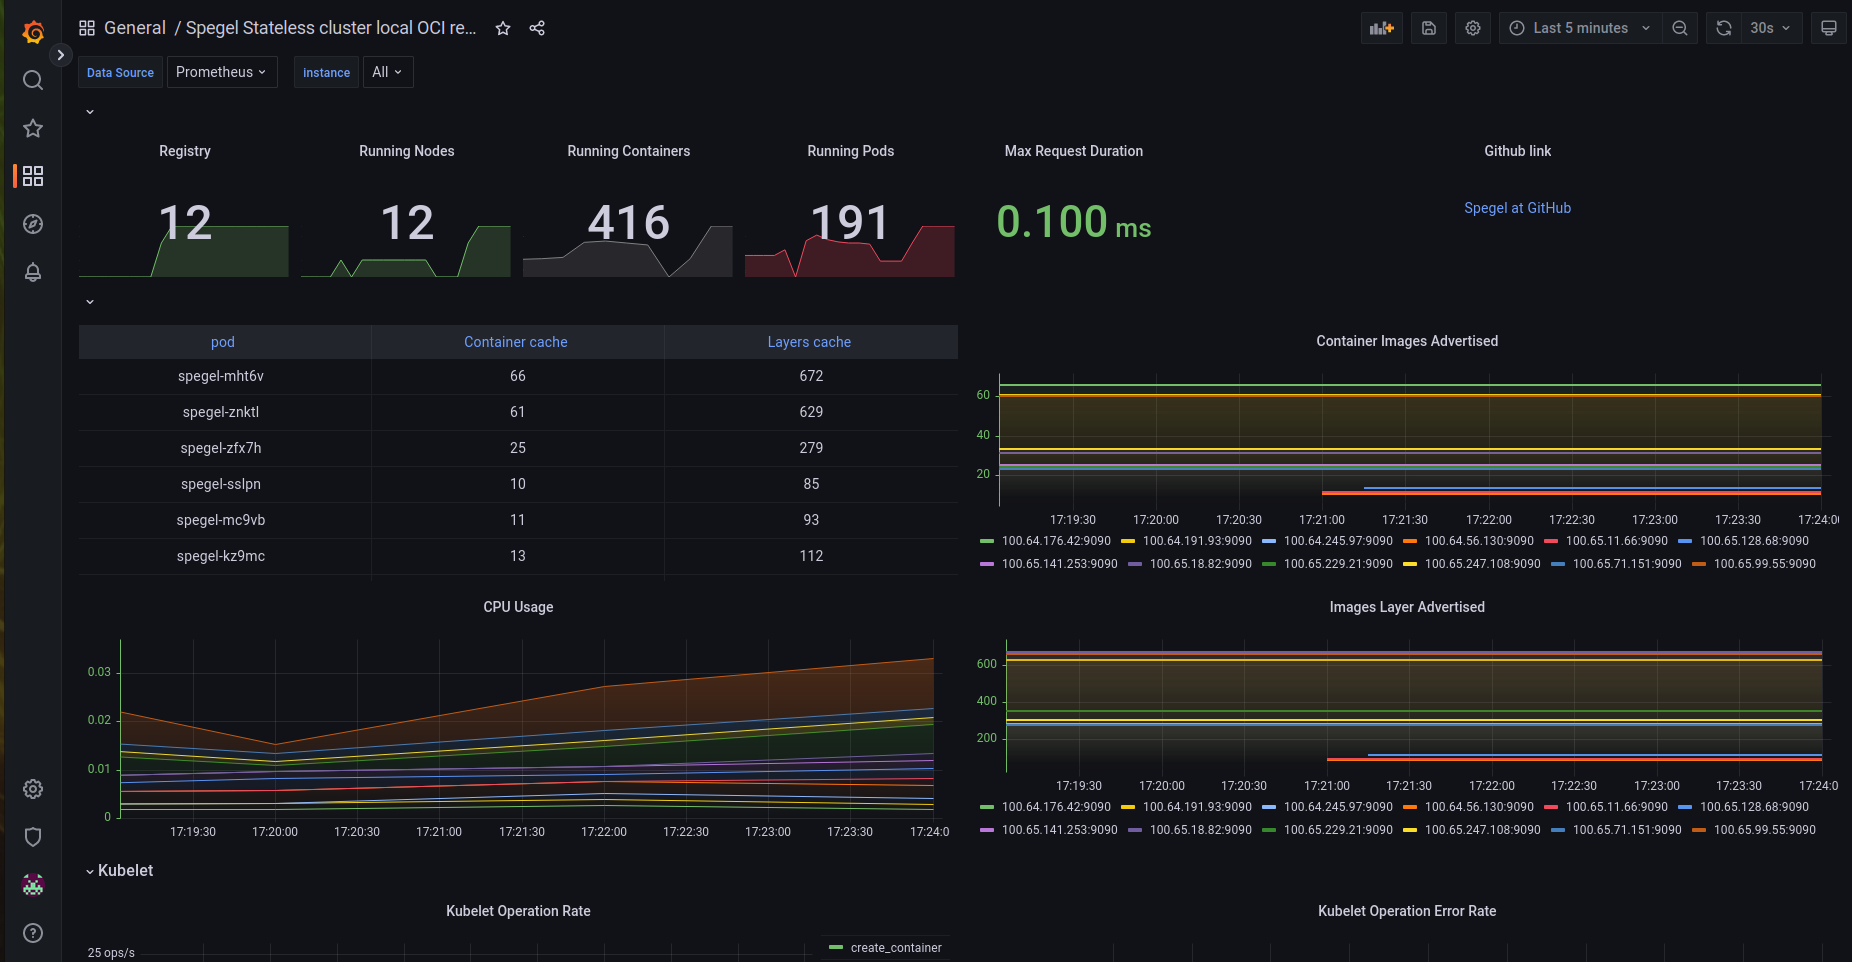
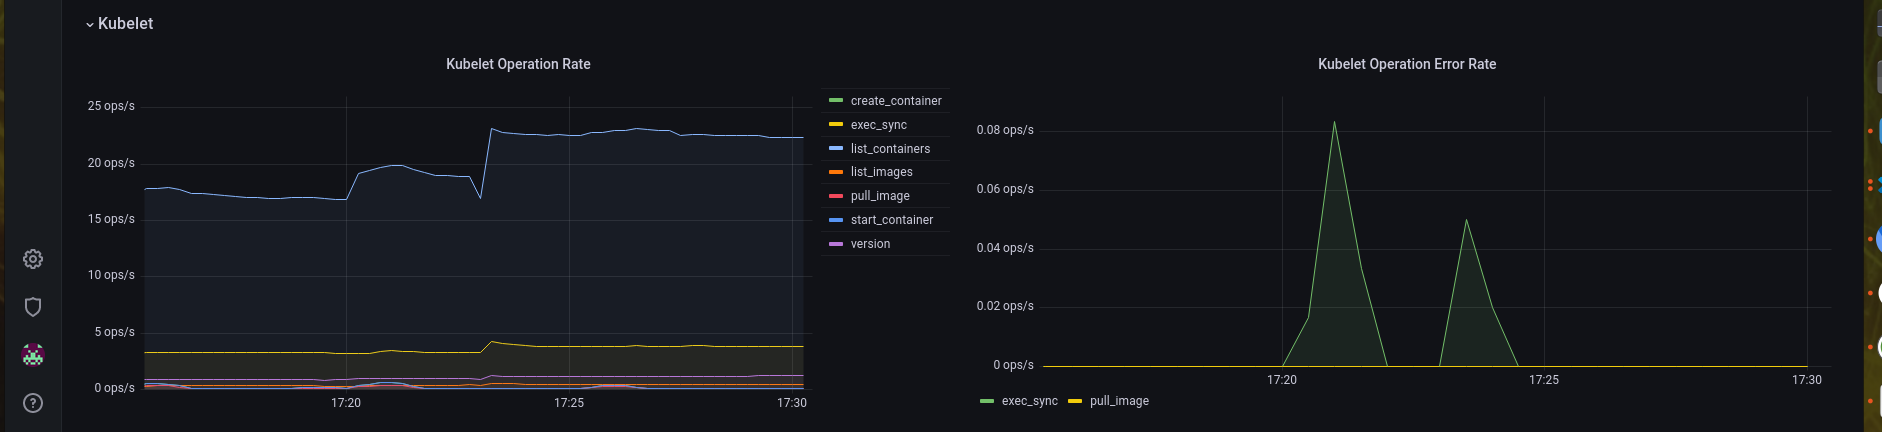
This dashboard monitors a stateless cluster local OCI registry mirror, focusing on the health and performance of container and Kubernetes workloads. It surfaces key metrics such as kubelet_running_containers, kubelet_running_pods, and http_request_duration_seconds_bucket to gauge resource activity, availability, and latency. Additionally, it highlights registry activity with spegel_advertised_keys and spegel_advertised_images, as well as node load via container_cpu_usage_seconds_total:sum_irate and kubelet_runtime_operations_total/kubelet_runtime_operations_errors_total for operational throughput and errors. Includes visuals for running nodes, containers, and pods, plus latency and operational rate insights.
Screenshots
Used Metrics 99
http_request_duration_seconds_bucket
kubelet_node_name
kubelet_running_containers
kubelet_running_pods
kubelet_runtime_operations_errors_total
kubelet_runtime_operations_total
node_namespace_pod_container:container_cpu_usage_seconds_total:sum_irate
spegel_advertised_images
spegel_advertised_keys