Speedtest-Exporter Dashboard 55,89055,890
Description
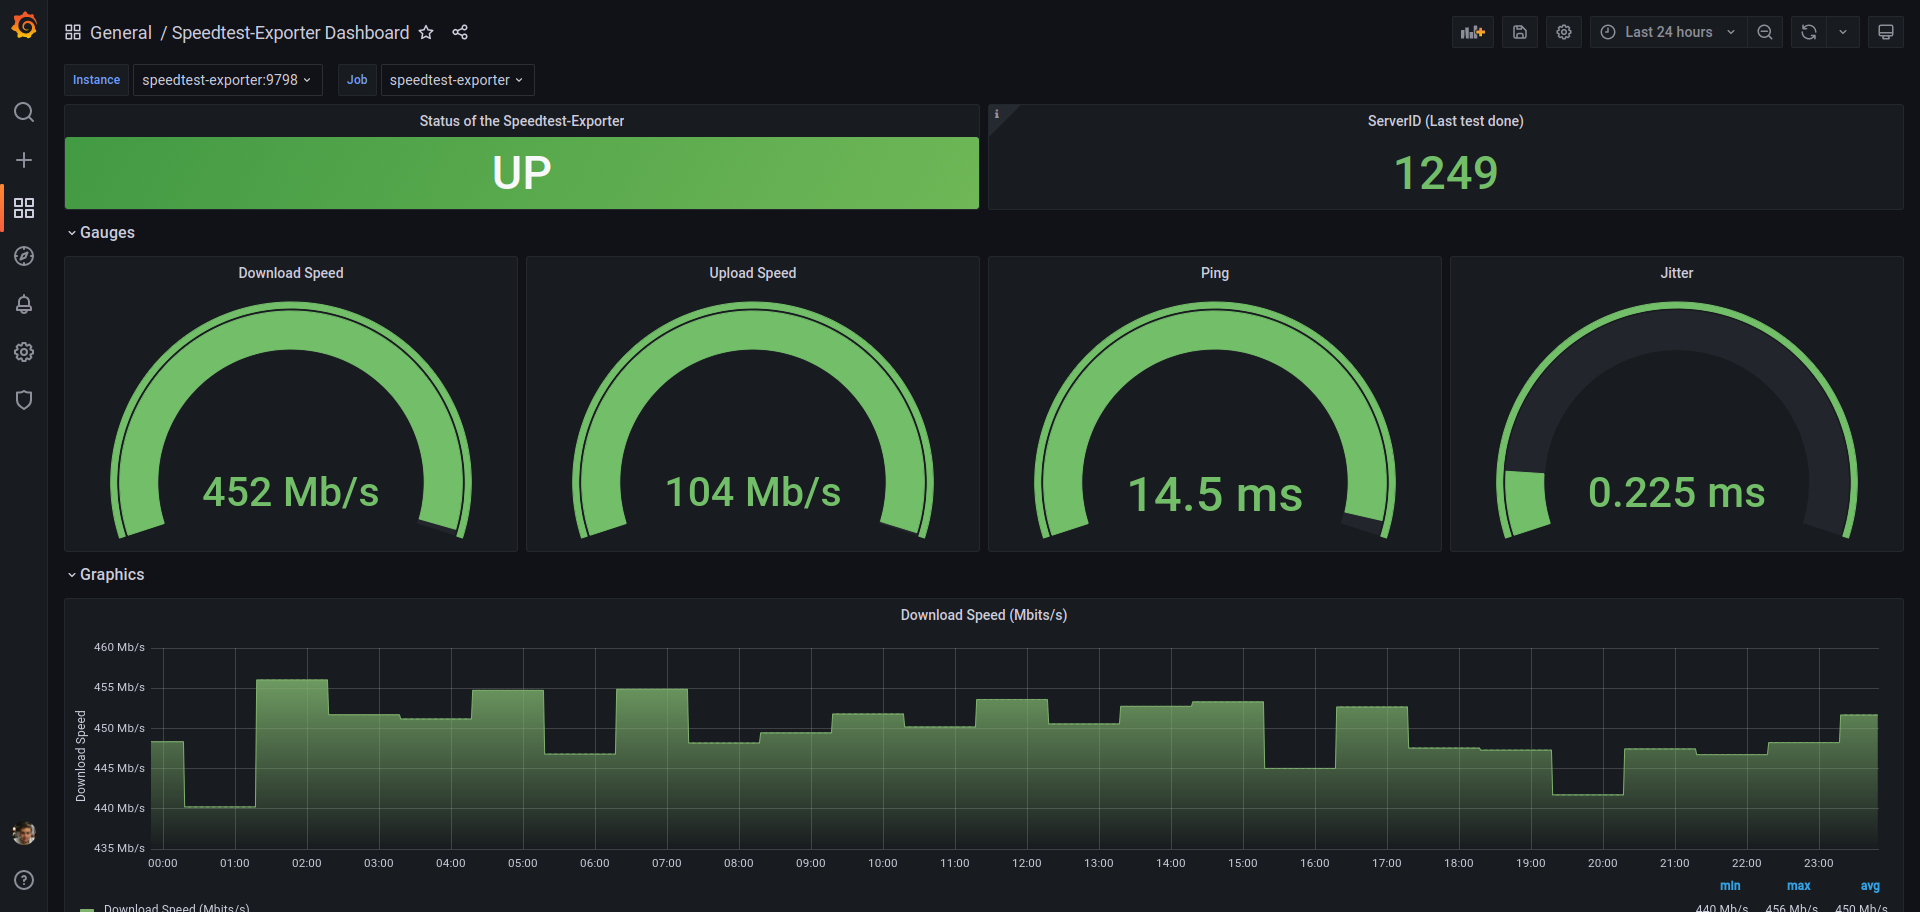
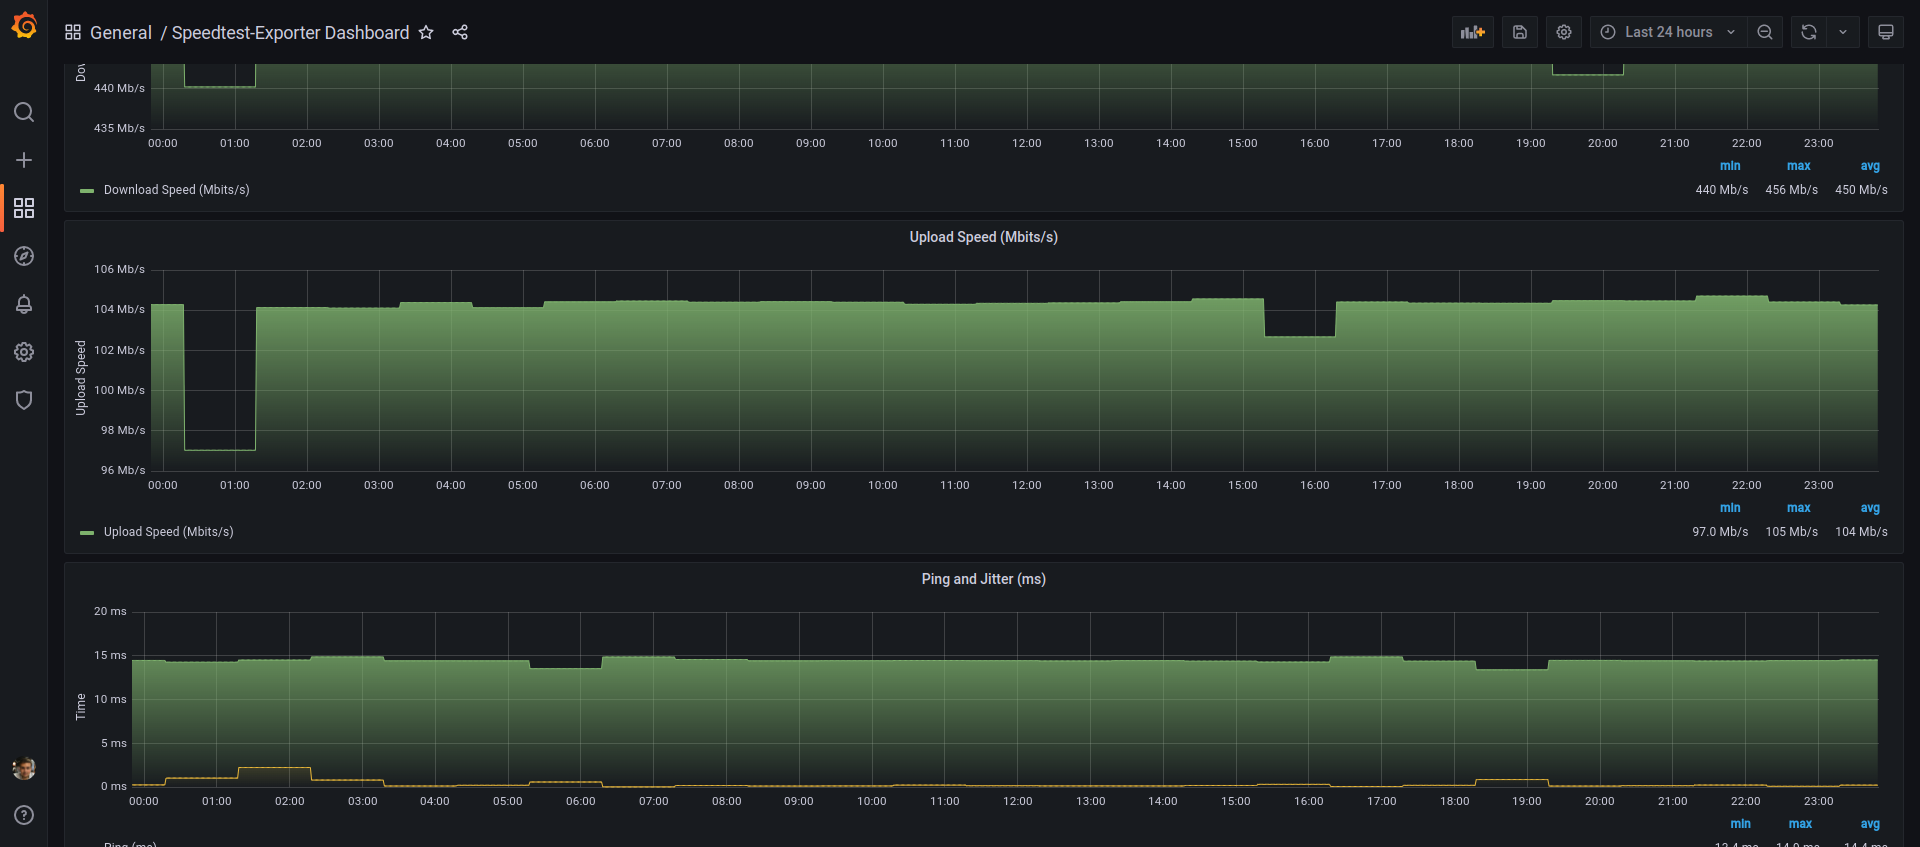
This dashboard monitors speedtest results from an exporter, displaying real-time performance metrics such as download and upload throughput, latency, and jitter alongside the selected server. It highlights the current server ID and the latest test results, with panels like speedtest_download_bits_per_second, speedtest_upload_bits_per_second, and speedtest_ping_latency_milliseconds providing a clear view of network performance and stability over time. Key features include time-series visualization, status indicators for the exporter, and per-test metrics in Mbps and milliseconds to help identify degradation or anomalies at a glance.
Screenshots
Used Metrics 66
speedtest_download_bits_per_second
speedtest_jitter_latency_milliseconds
speedtest_ping_latency_milliseconds
speedtest_server_id
speedtest_up
speedtest_upload_bits_per_second