Speedtest Dashboard 787787
11/19/2019
11/19/2019
1
Host Metrics
>=6.4.4
Prometheus
Description
A dashboard for Prometheus Speedtest Exporter
Screenshots
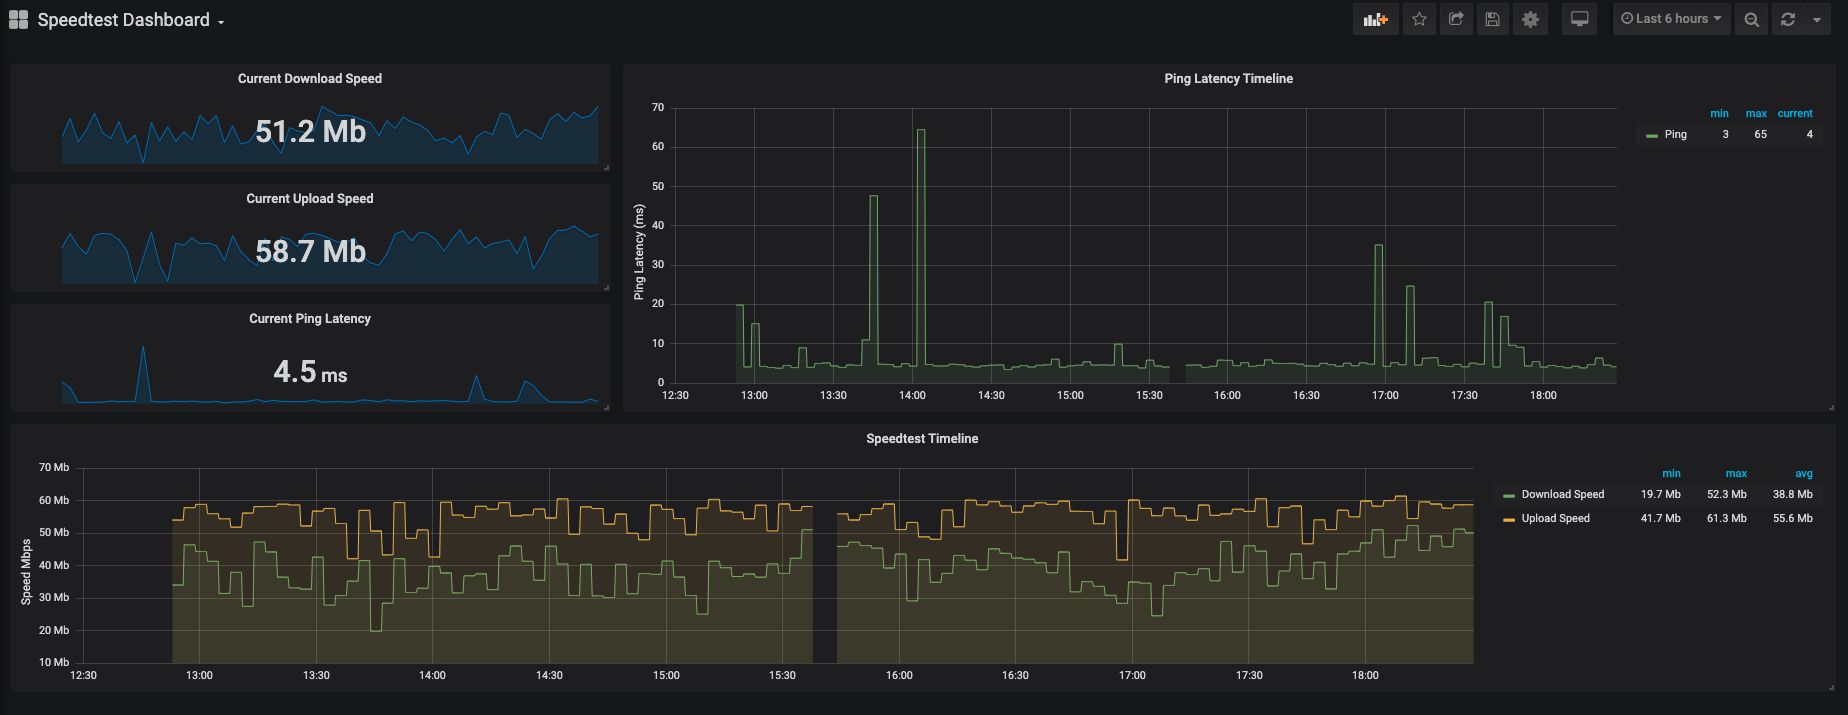
Used Metrics 33
download_speed_bps
ping_ms
upload_speed_bps
Get Dashboard✕
Download
Copy to Clipboard