Spanmetrics Demo Dashboard 5,1595,159
3/12/2023
4/3/2023
1
>=9.3.6
Prometheus
Description
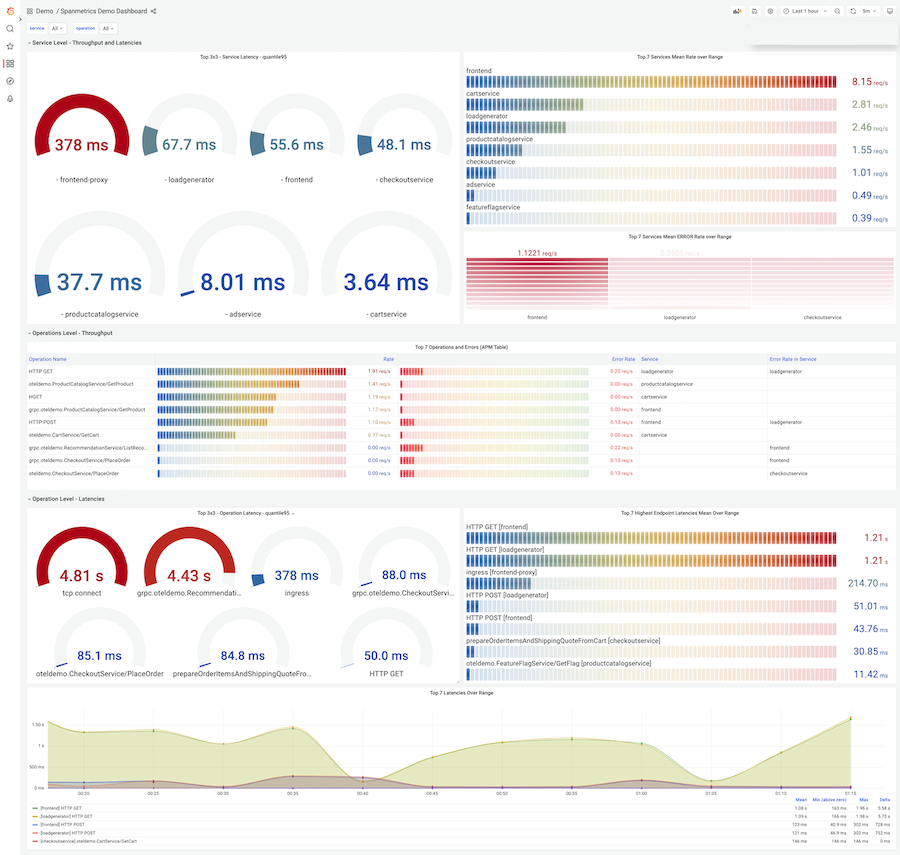
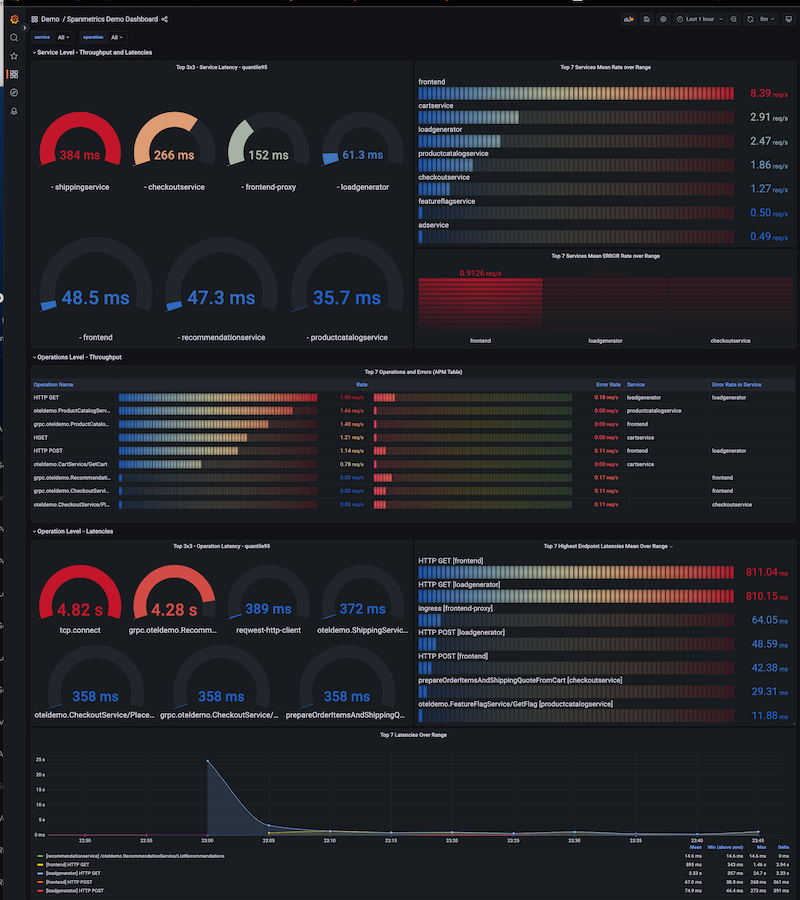
Spanmetrics way of application view.
Screenshots
Used Metrics 66
calls_total
latency_bucket
latency_count
latency_sum
operation
topk
Get Dashboard✕
Download
Copy to Clipboard