Sonarr v3 140,187140,187 5.0 (1 reviews)
Description
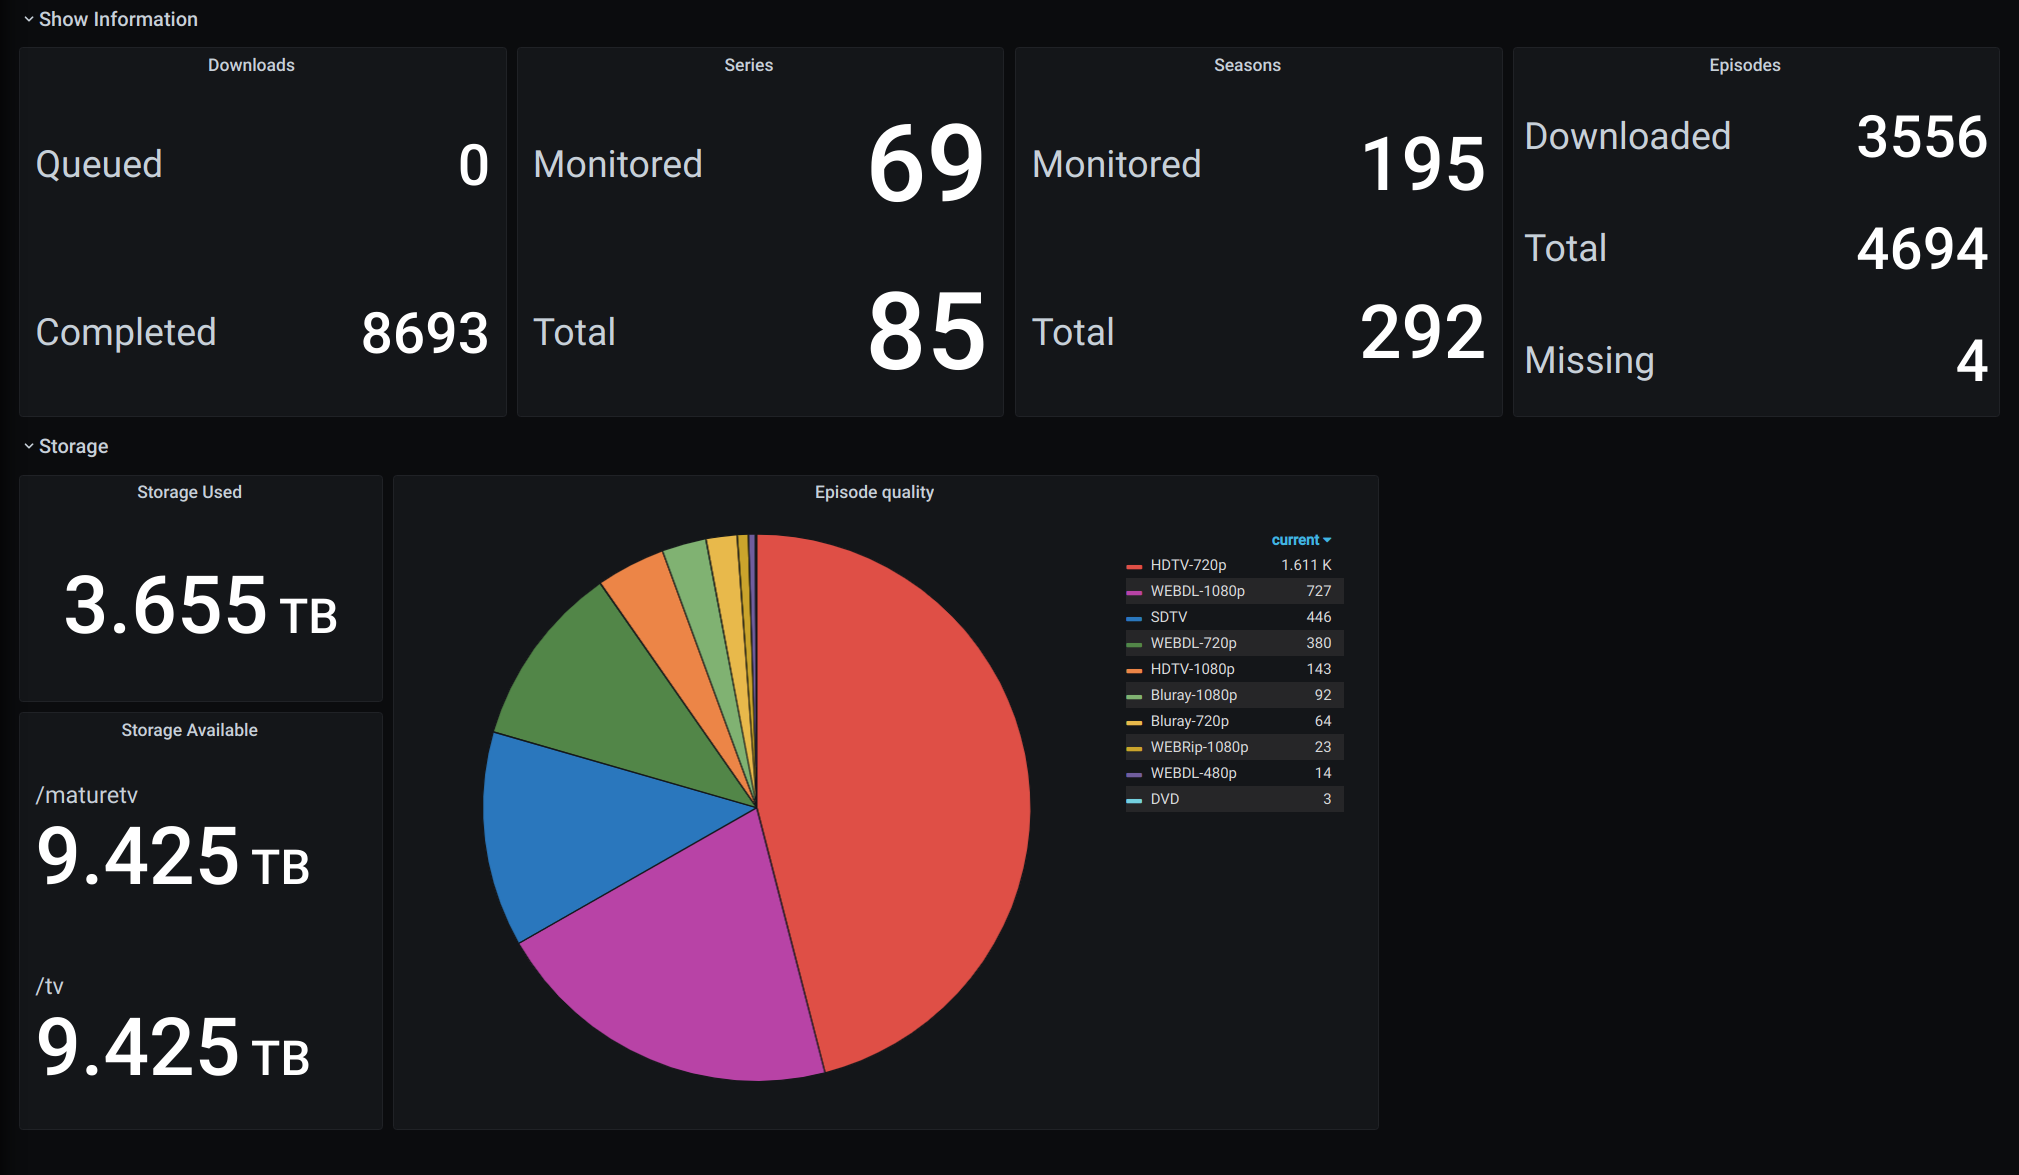
This dashboard monitors a Sonarr v3 instance, providing insights into downloads, series, seasons, and episodes along with storage metrics. It emphasizes operational activity and health by tracking queue/history totals and monitored versus total counts for series, seasons, and episodes, as well as file size and storage status. Key metrics include sonarr_queue_total, sonarr_history_total, and sonarr_series_monitored_total to reflect ongoing tasks, completed history, and configured monitoring, respectively, while storage and episode quality insights are supported by sonarr_series_filesize_bytes and related indicators.
Screenshots
Used Metrics 1212
sonarr_episode_downloaded_total
sonarr_episode_missing_total
sonarr_episode_quality_total
sonarr_episode_total
sonarr_history_total
sonarr_queue_total
sonarr_rootfolder_freespace_bytes
sonarr_season_monitored_total
sonarr_season_total
sonarr_series_filesize_bytes
sonarr_series_monitored_total
sonarr_series_total