Sonarqube - System Dashboard 7,4867,486 5.0 (1 reviews)
Description
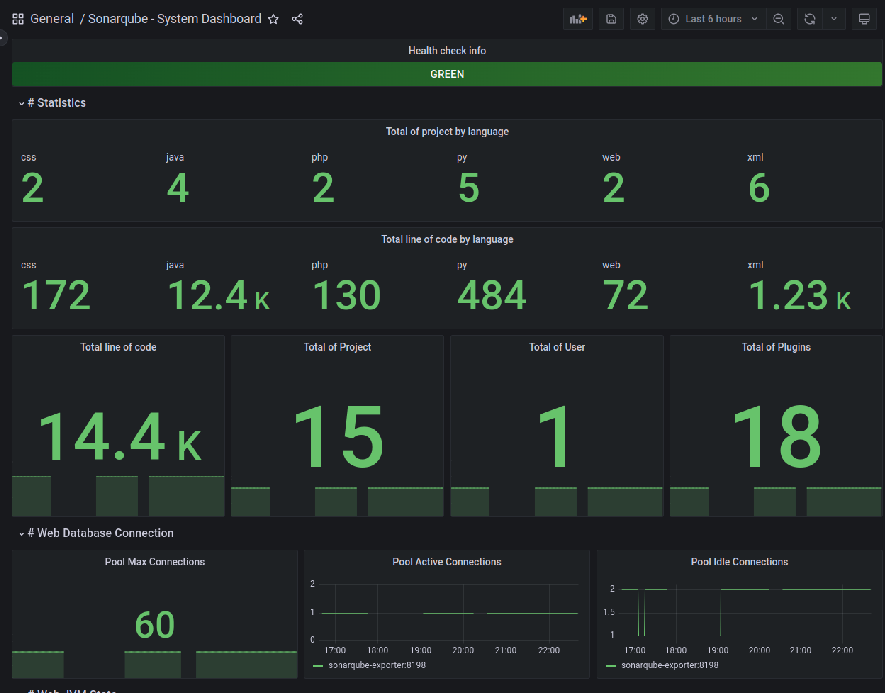
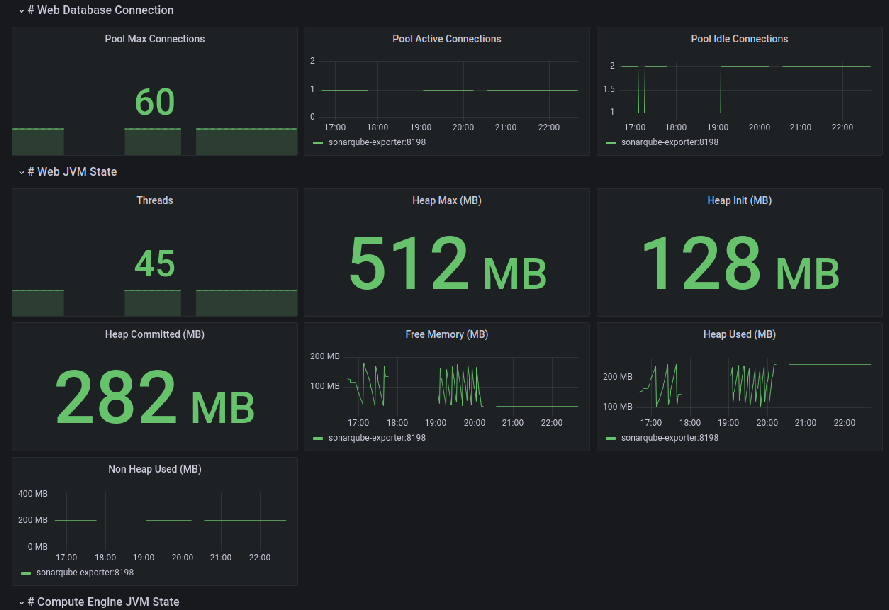
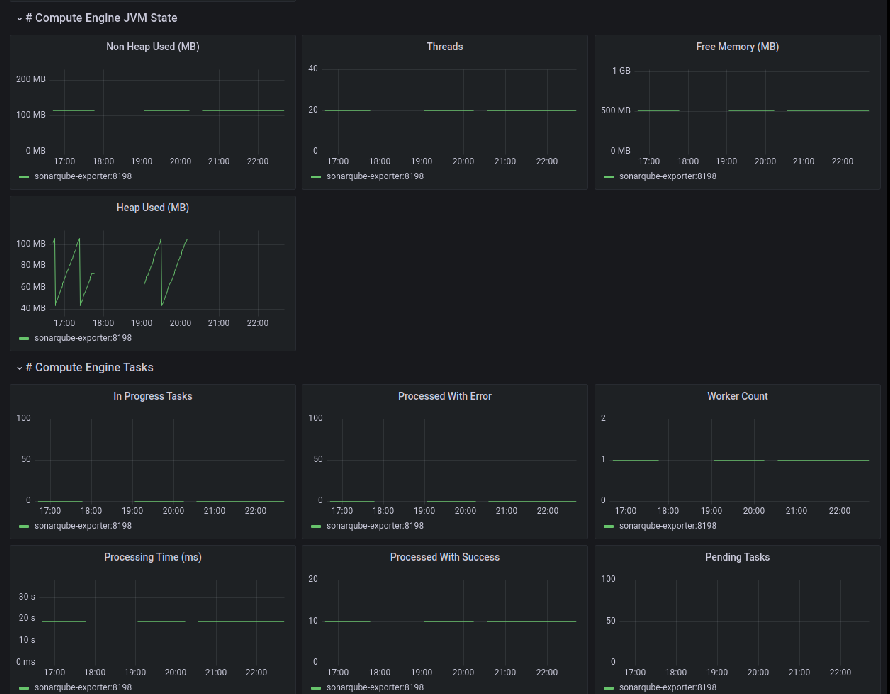
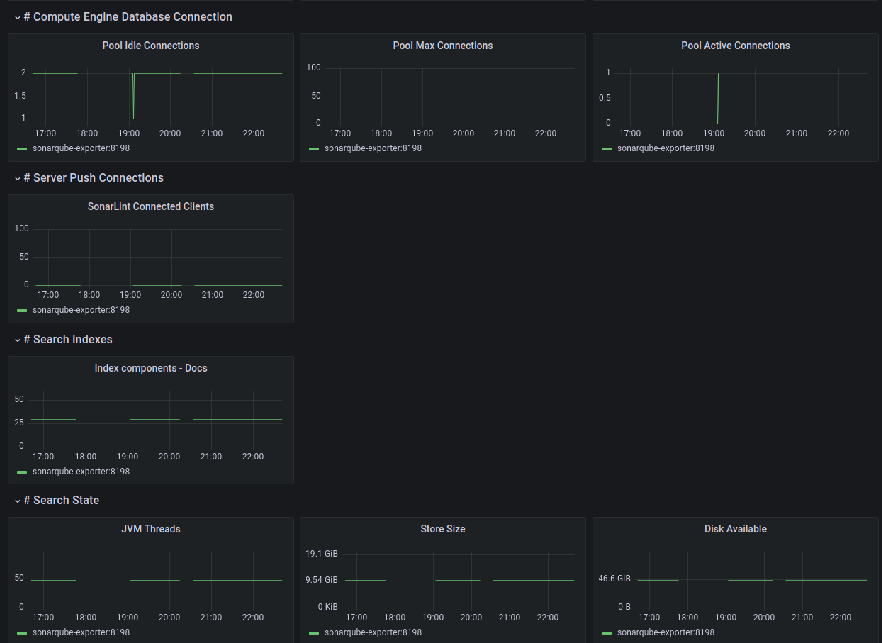
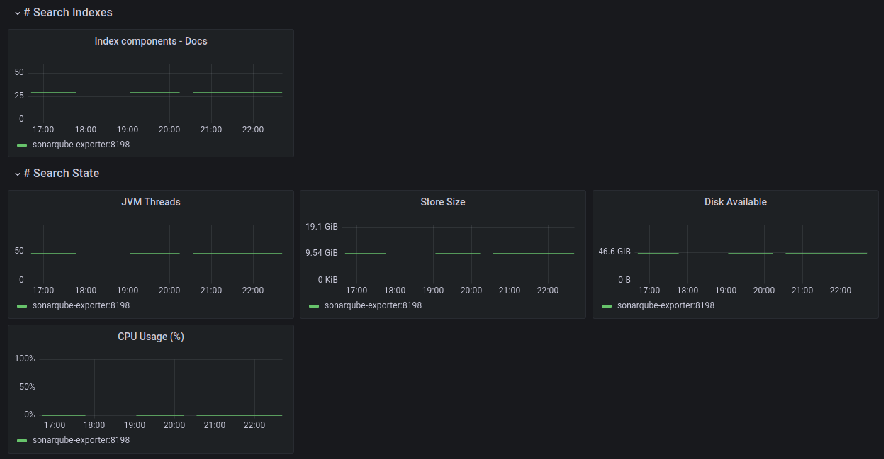
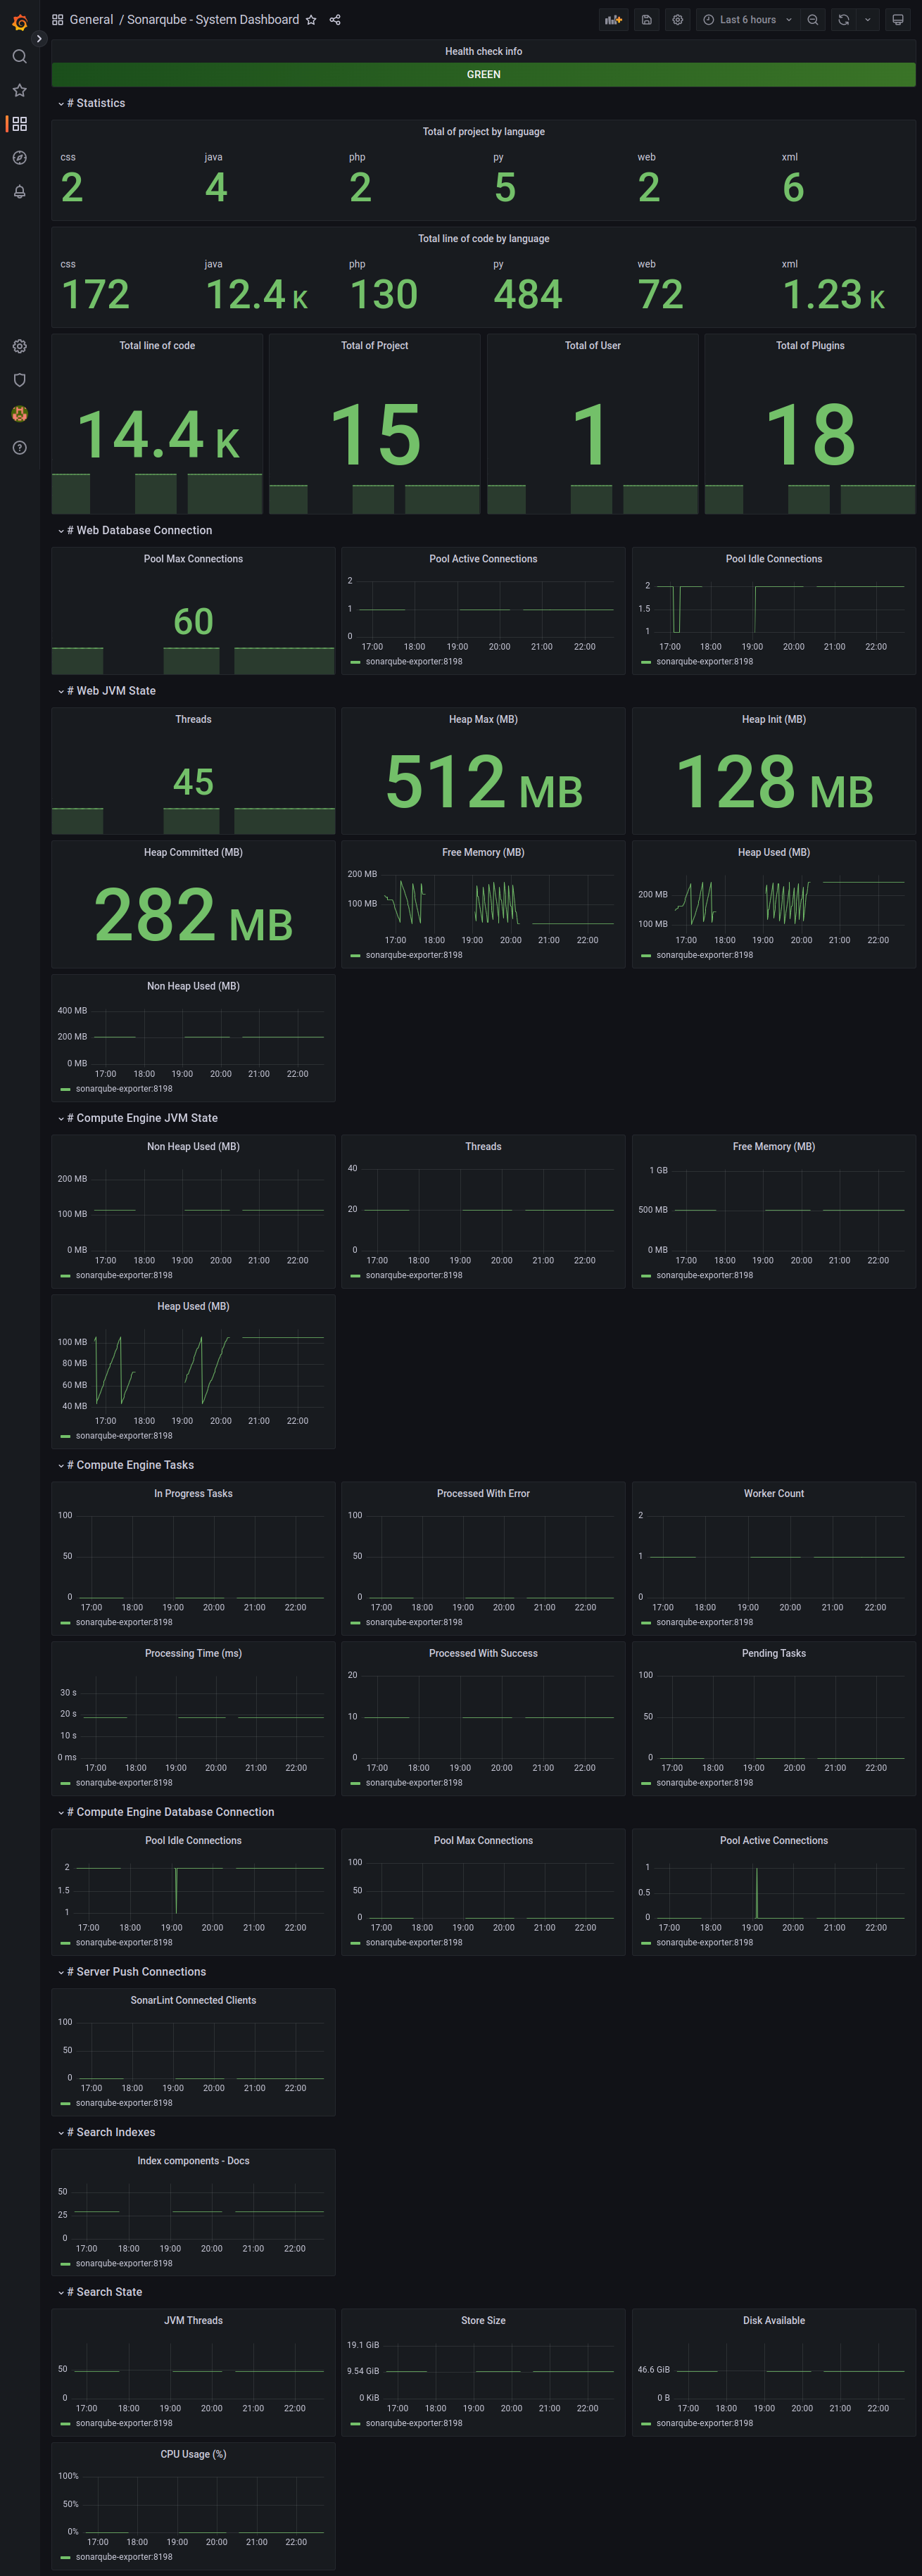
The Sonarqube - System Dashboard dashboard presents all metrics in detail of Sonarqube instance.
Screenshots
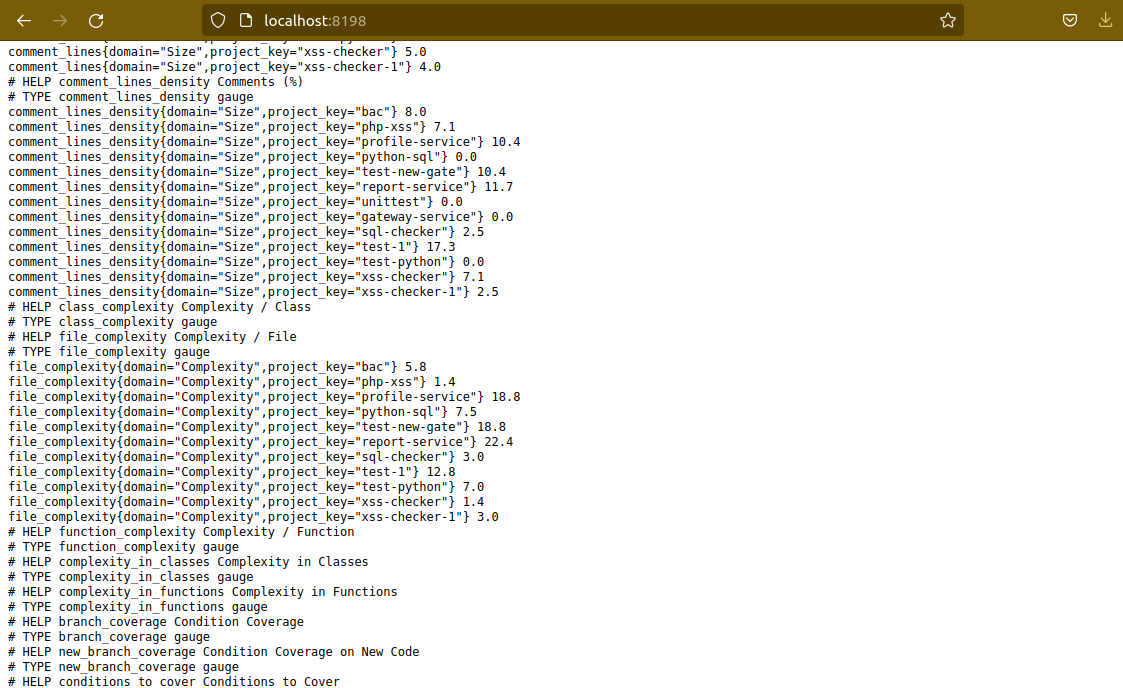
Used Metrics 3636
compute_engine_jvm_free_memory
compute_engine_jvm_heap_used
compute_engine_jvm_non_heap_used
compute_engine_jvm_threads
compute_engine_pool_active_connection
compute_engine_pool_idle_connections
compute_engine_pool_max_connection
compute_engine_tasks_error_progress
compute_engine_tasks_inprogress
compute_engine_tasks_pending
compute_engine_tasks_progressing_time
compute_engine_tasks_success_progress
compute_engine_tasks_worker
cpu_usage
disk_available
health_check_info
index_docs
jvm_threads
ncloc_count_by_language
project_count_by_language
sonarlint_client
store_size
total_line_of_code
total_of_plugins
total_of_project
total_of_user
web_jvm_free_memory
web_jvm_heap_commited
web_jvm_heap_init
web_jvm_heap_max
web_jvm_heap_used
web_jvm_non_heap_used
web_jvm_threads
web_pool_active_connection
web_pool_idle_connections
web_pool_max_connection