Solr Dashboard 965,513965,513
6/11/2020
5/20/2021
7
Databases
>=7.3.0
Prometheus
Description
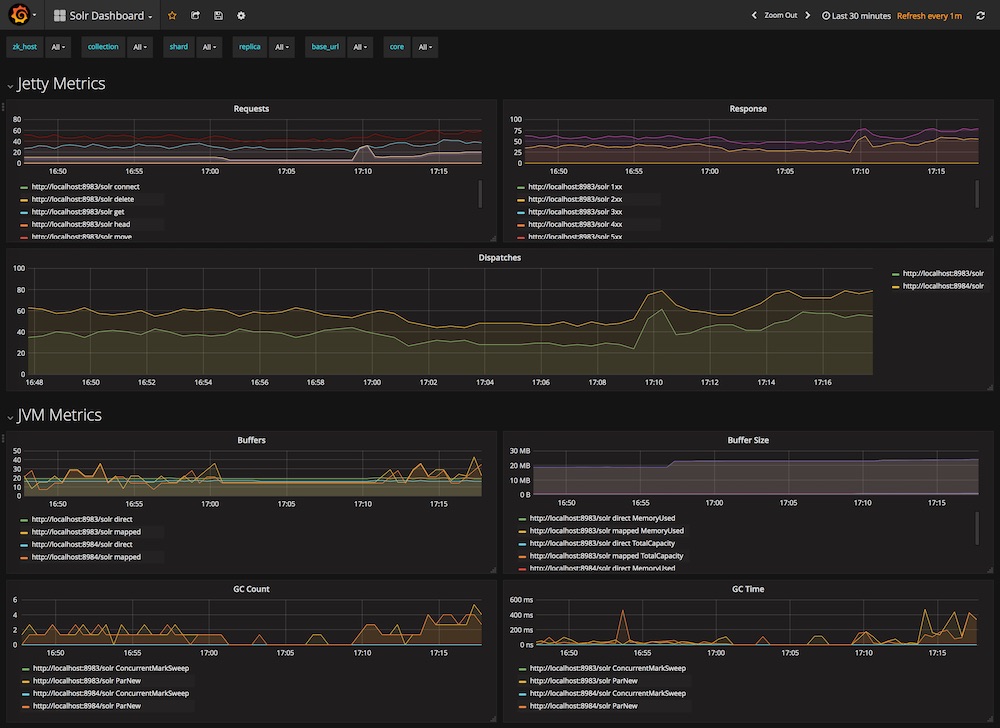
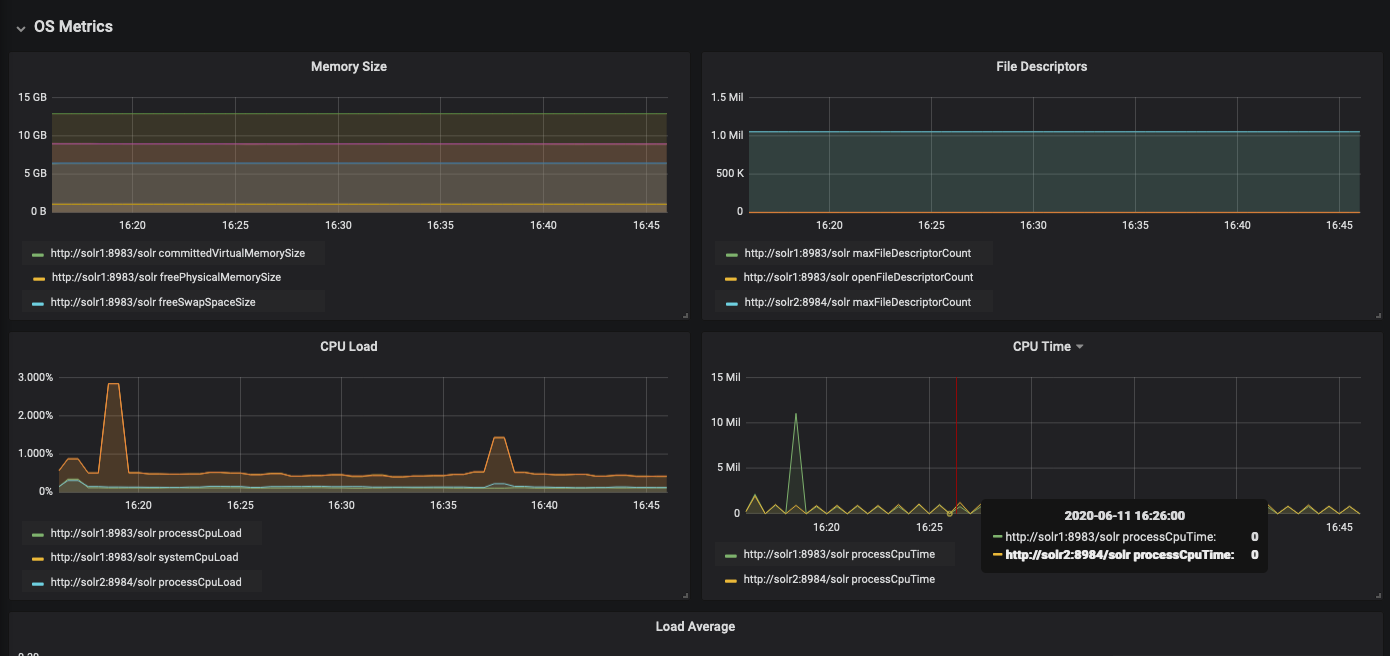
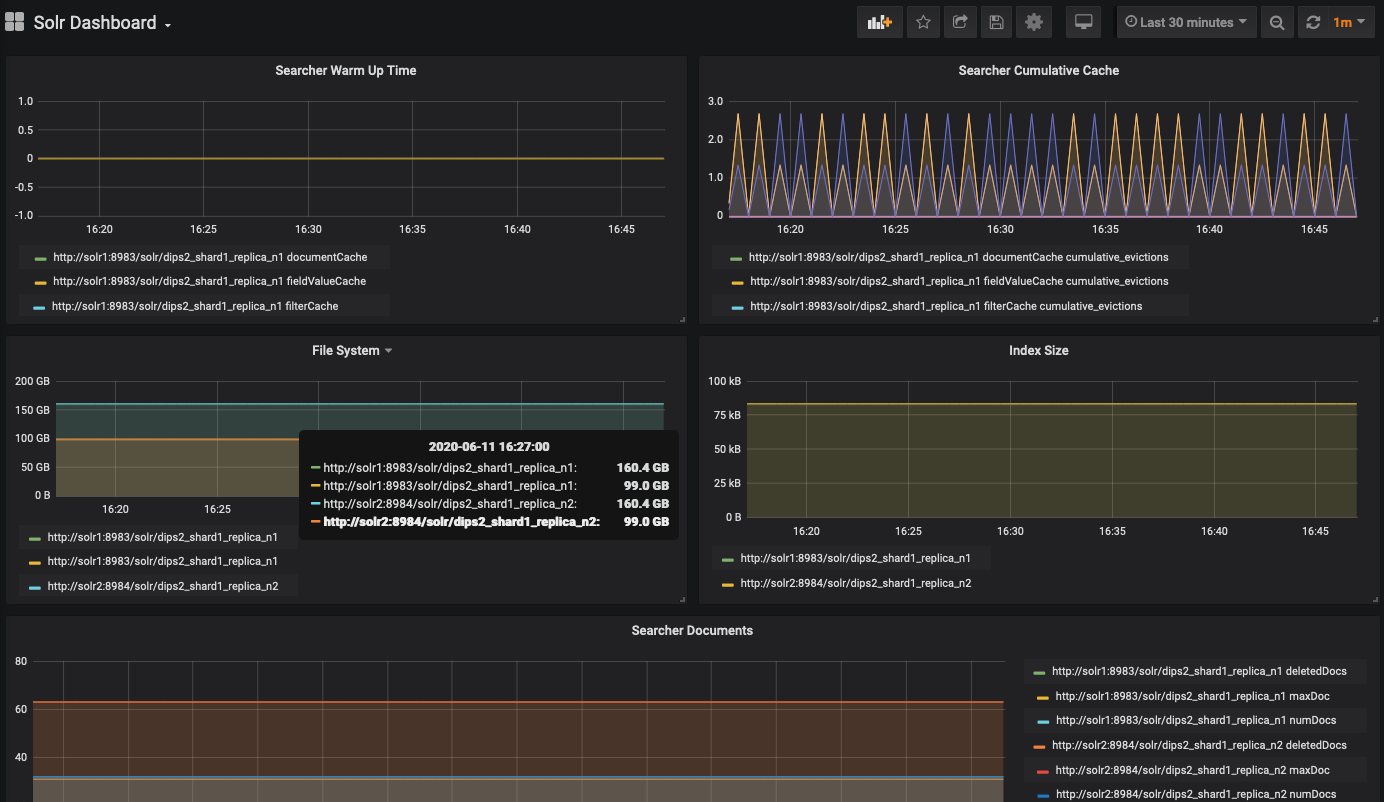
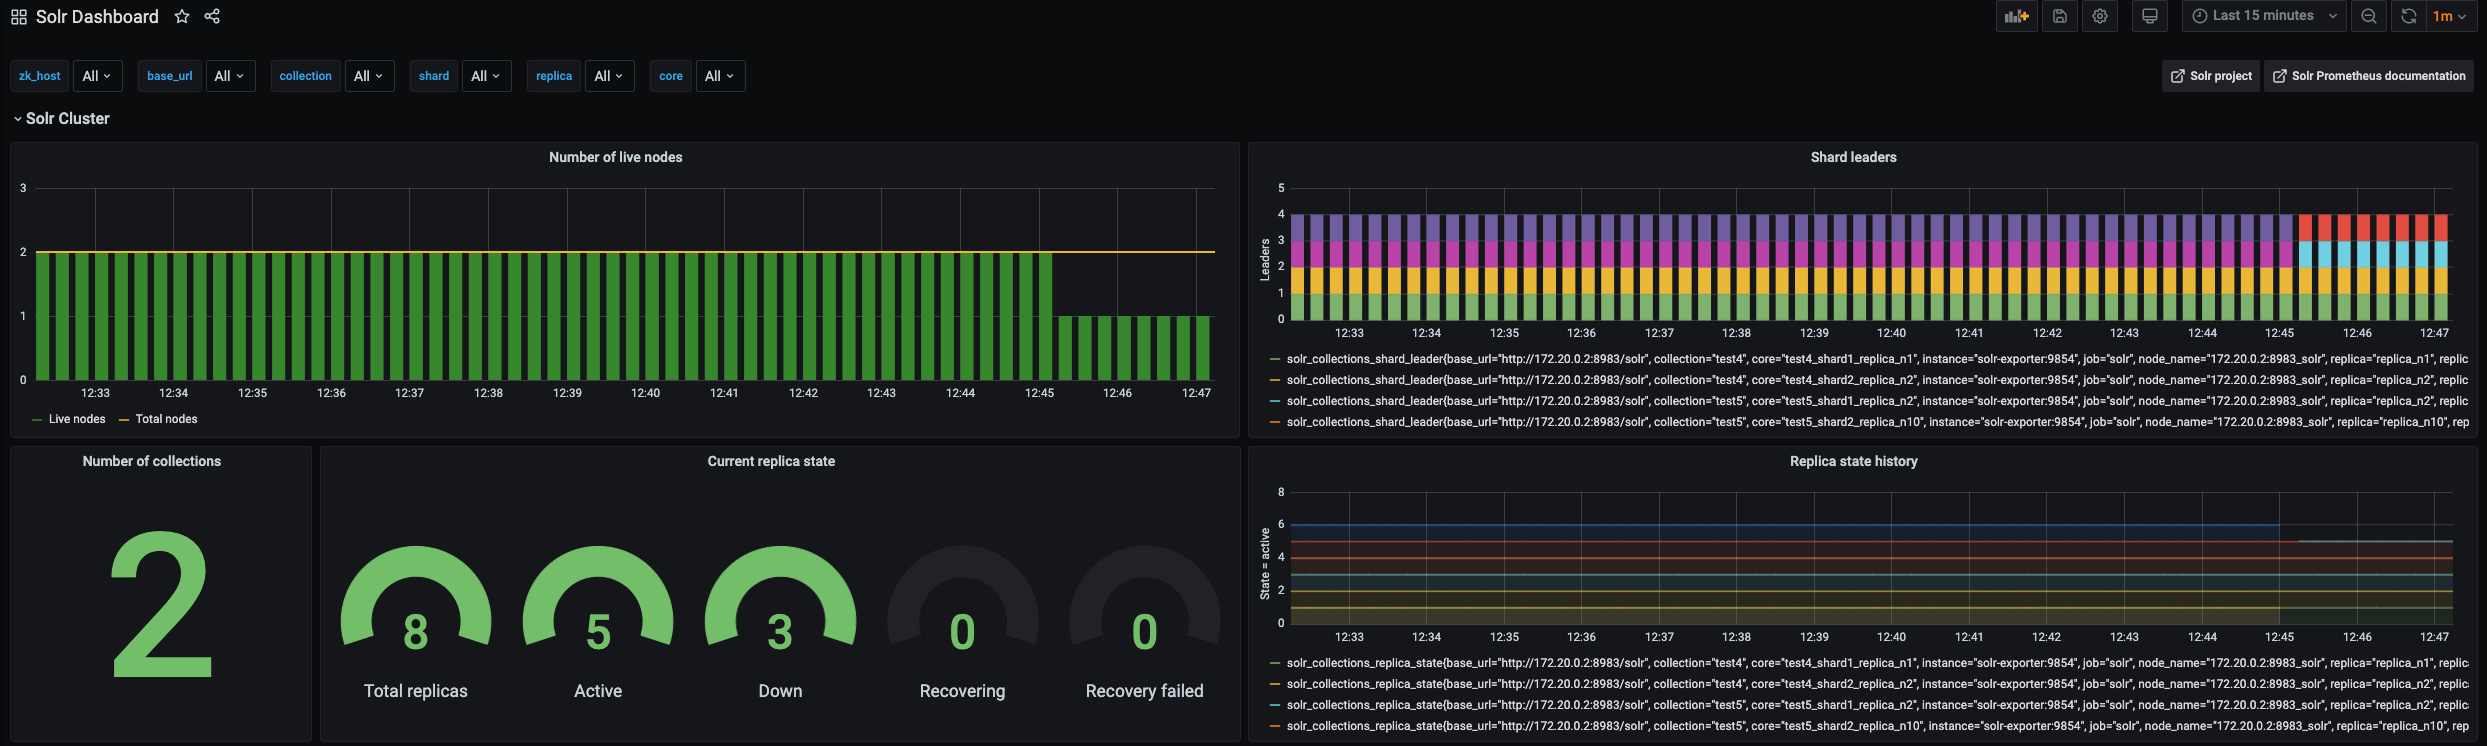
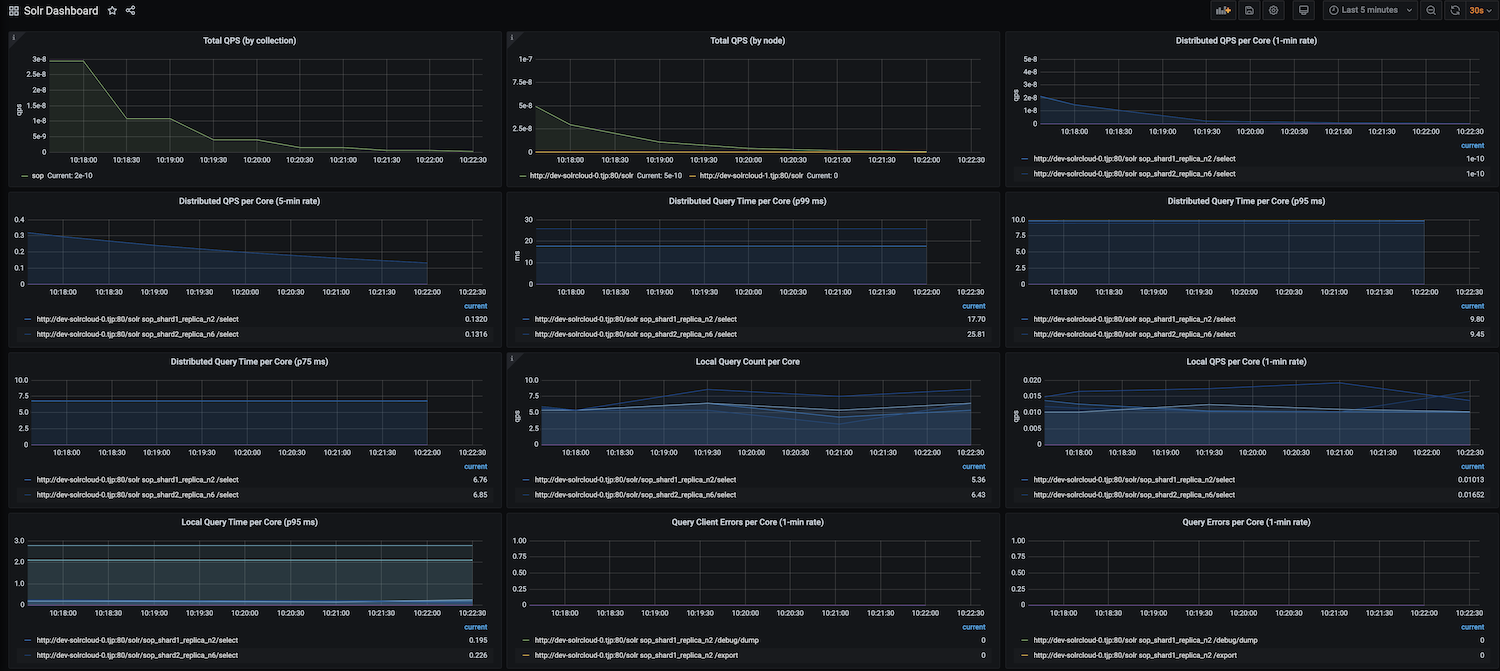
This dashboard monitors a Solr cloud deployment by tracking core health and cluster topology. It highlights live node counts, Zookeeper nodestatus, and shard leader status, providing a concise view of replica distribution, collection health, and ensemble size with both current states and historical trends using metrics such as solr_collections_live_nodes, solr_zookeeper_nodestatus, and solr_collections_shard_leader.
Screenshots
Used Metrics 55
solr_collections_live_nodes
solr_collections_replica_state
solr_collections_shard_leader
solr_zookeeper_ensemble_size
solr_zookeeper_nodestatus
Get Dashboard✕
Download
Copy to Clipboard