SNMP device 1,1361,136
1/22/2024
3/23/2024
2
>=10.2.3
Prometheus
Description
Screenshots
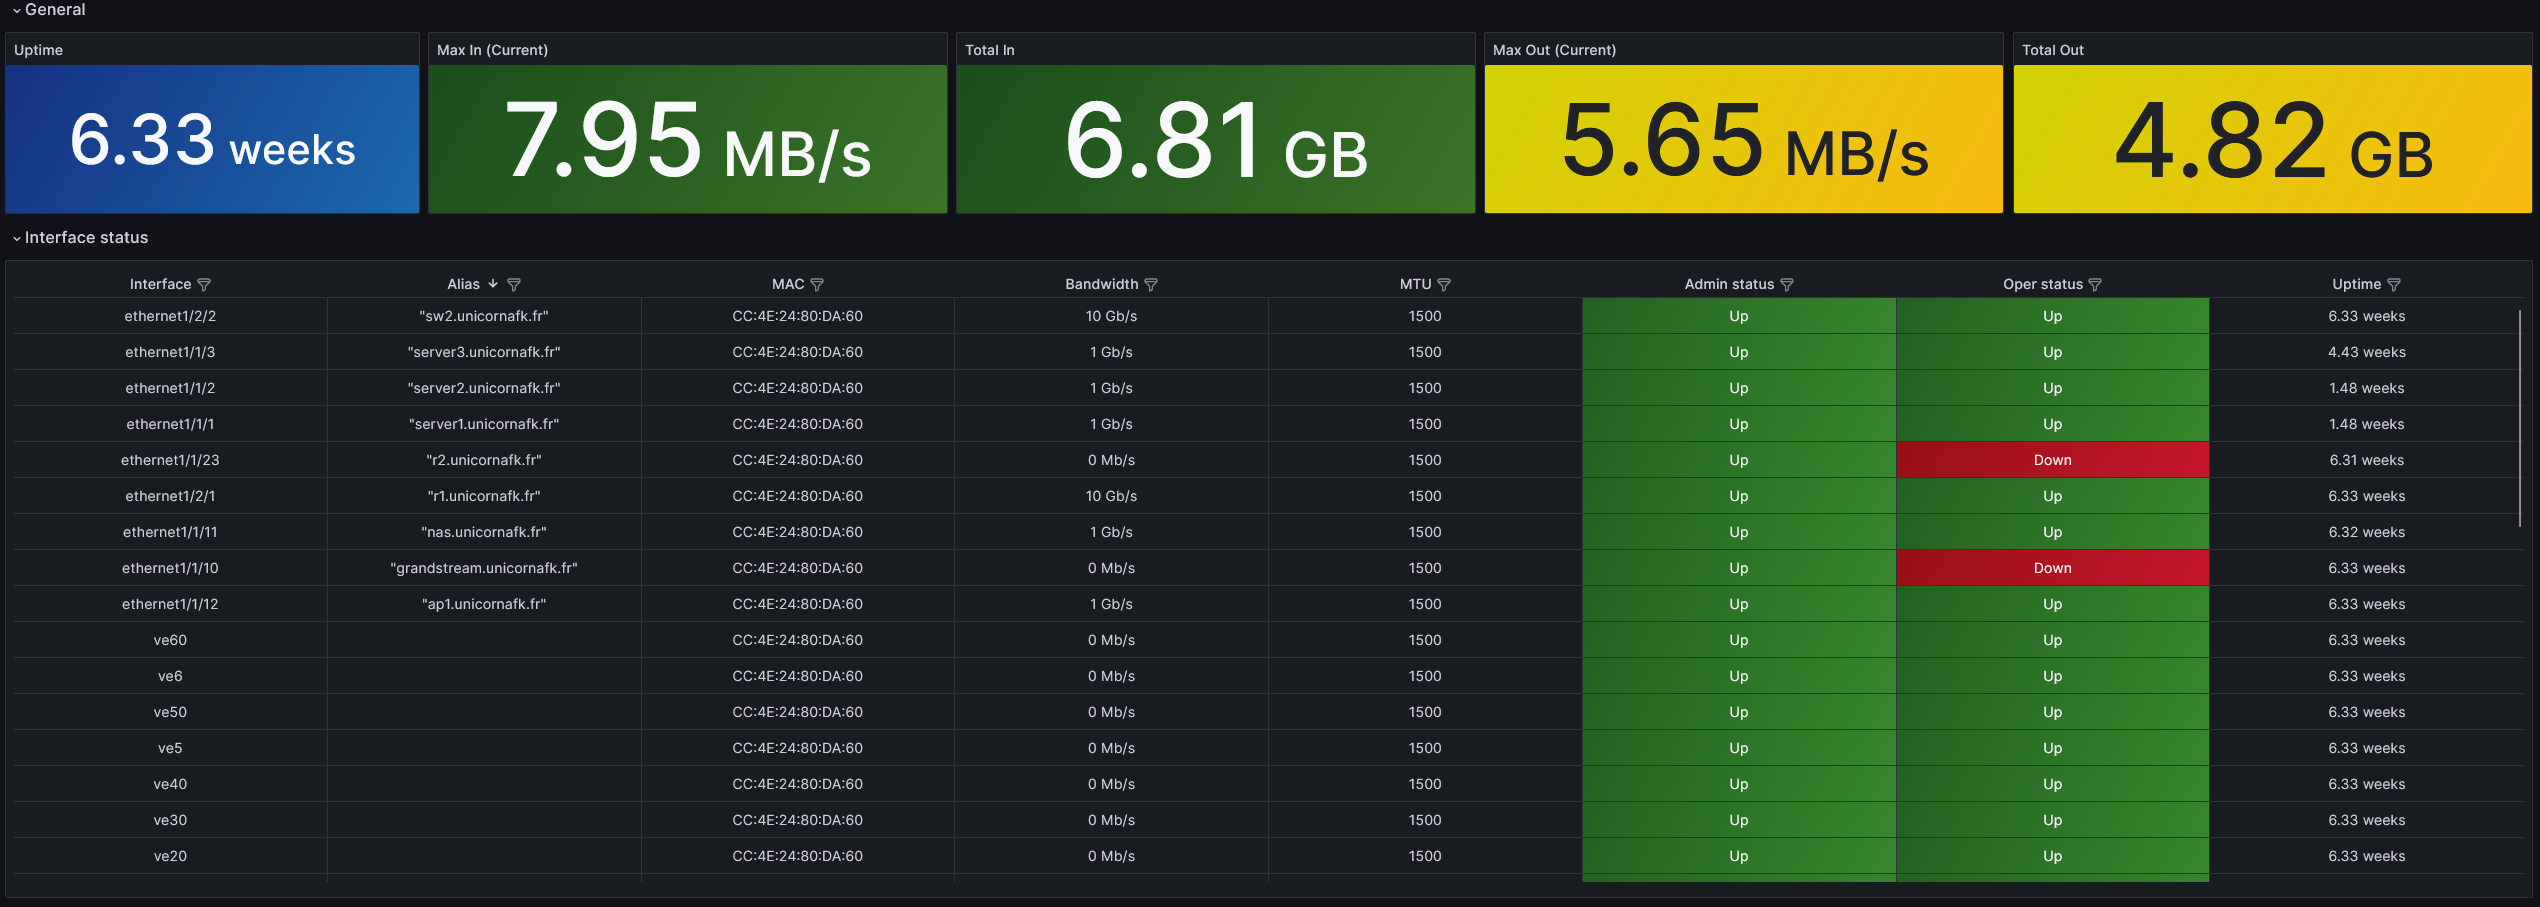
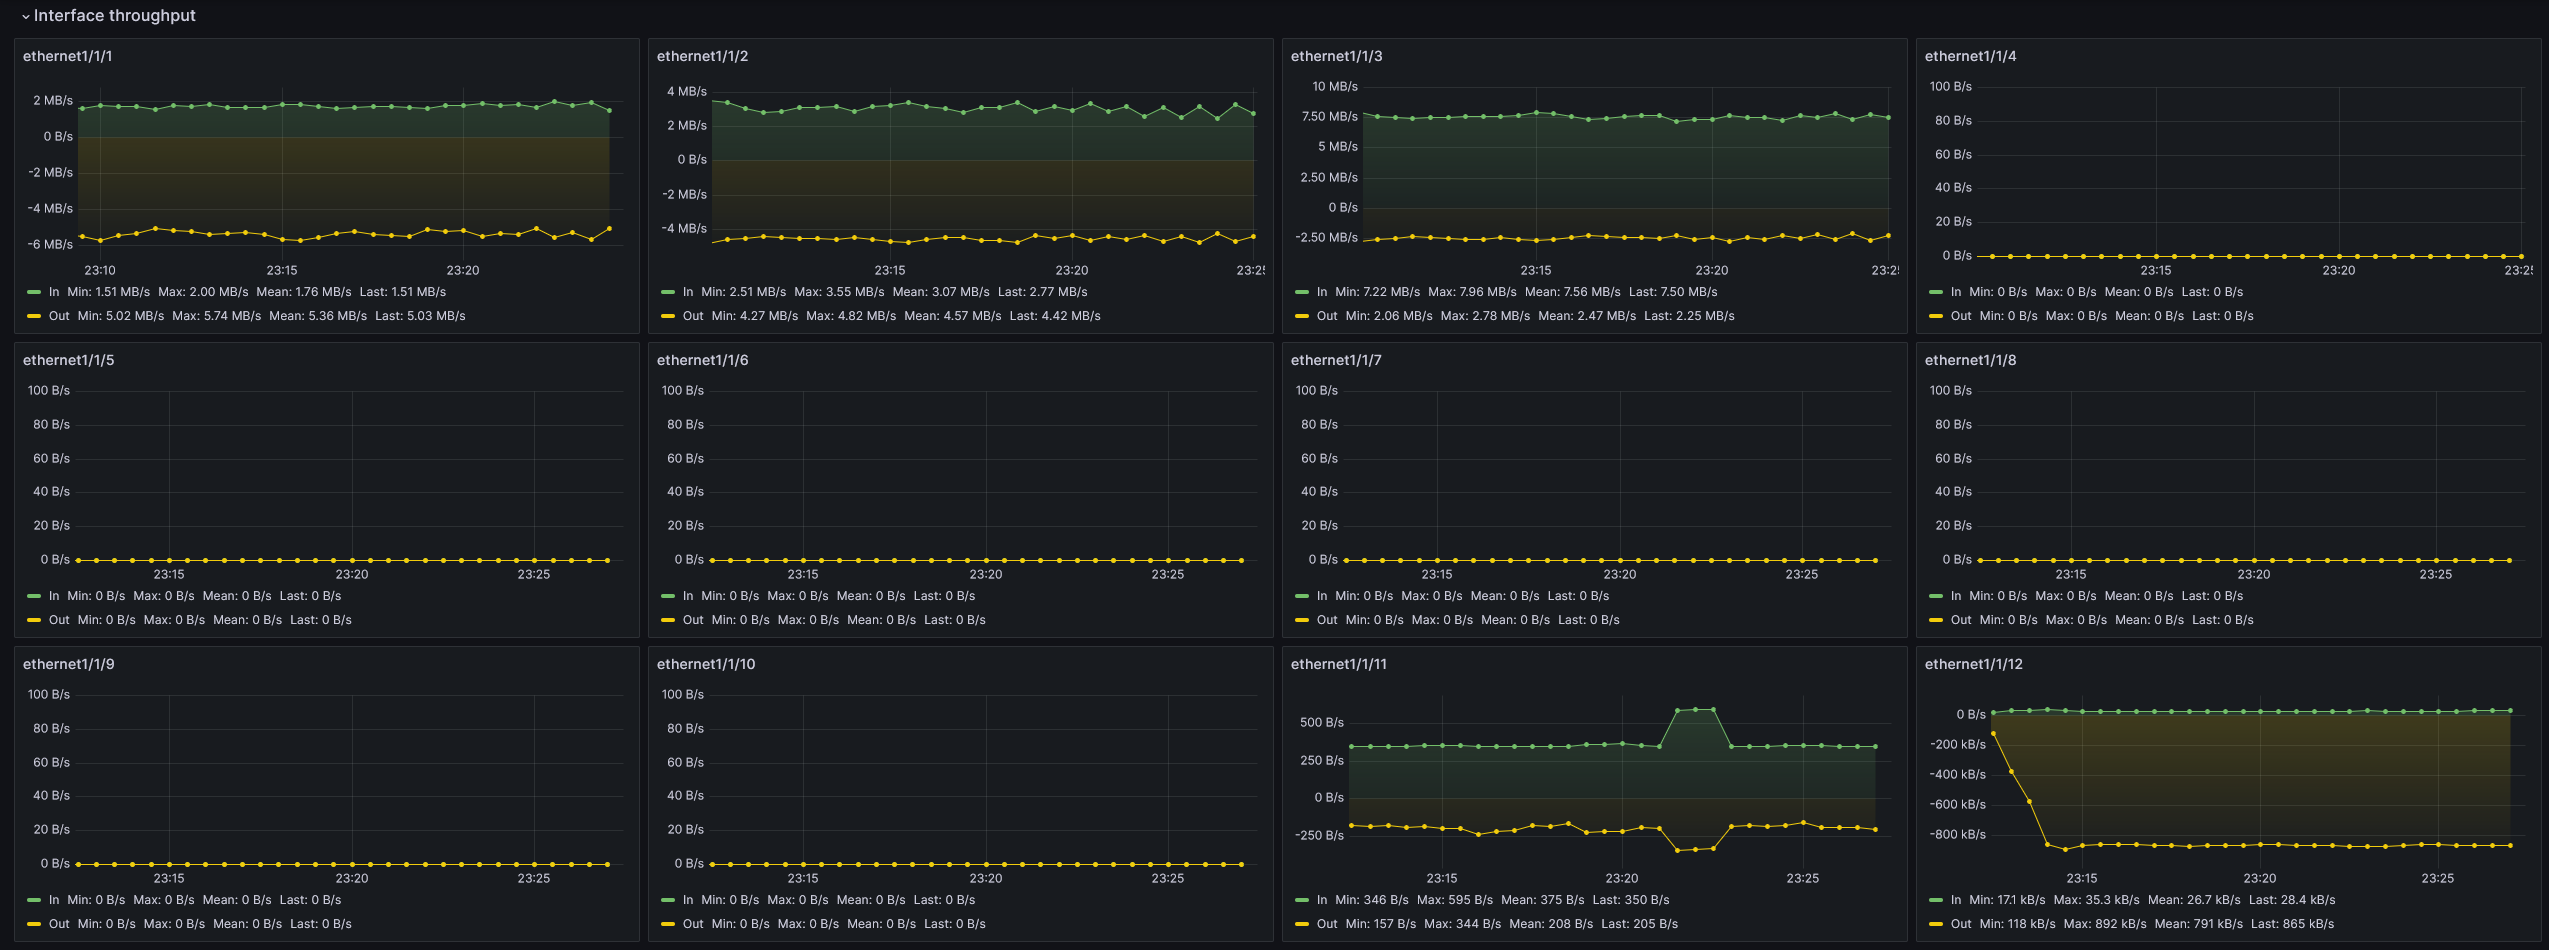
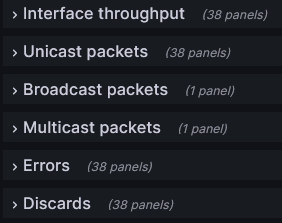
Used Metrics 99
ifAdminStatus
ifHCInOctets
ifHCOutOctets
ifHighSpeed
ifLastChange
ifMtu
ifOperStatus
ifPhysAddress
sysUpTime
Get Dashboard✕
Download
Copy to Clipboard