SMARTctl Exporter Dashboard 31,56531,565
1/2/2025
1/7/2025
2
Host Metrics
>=11.4.0
Prometheus
Description
Extended smartctl-exporter Dashboard
Screenshots
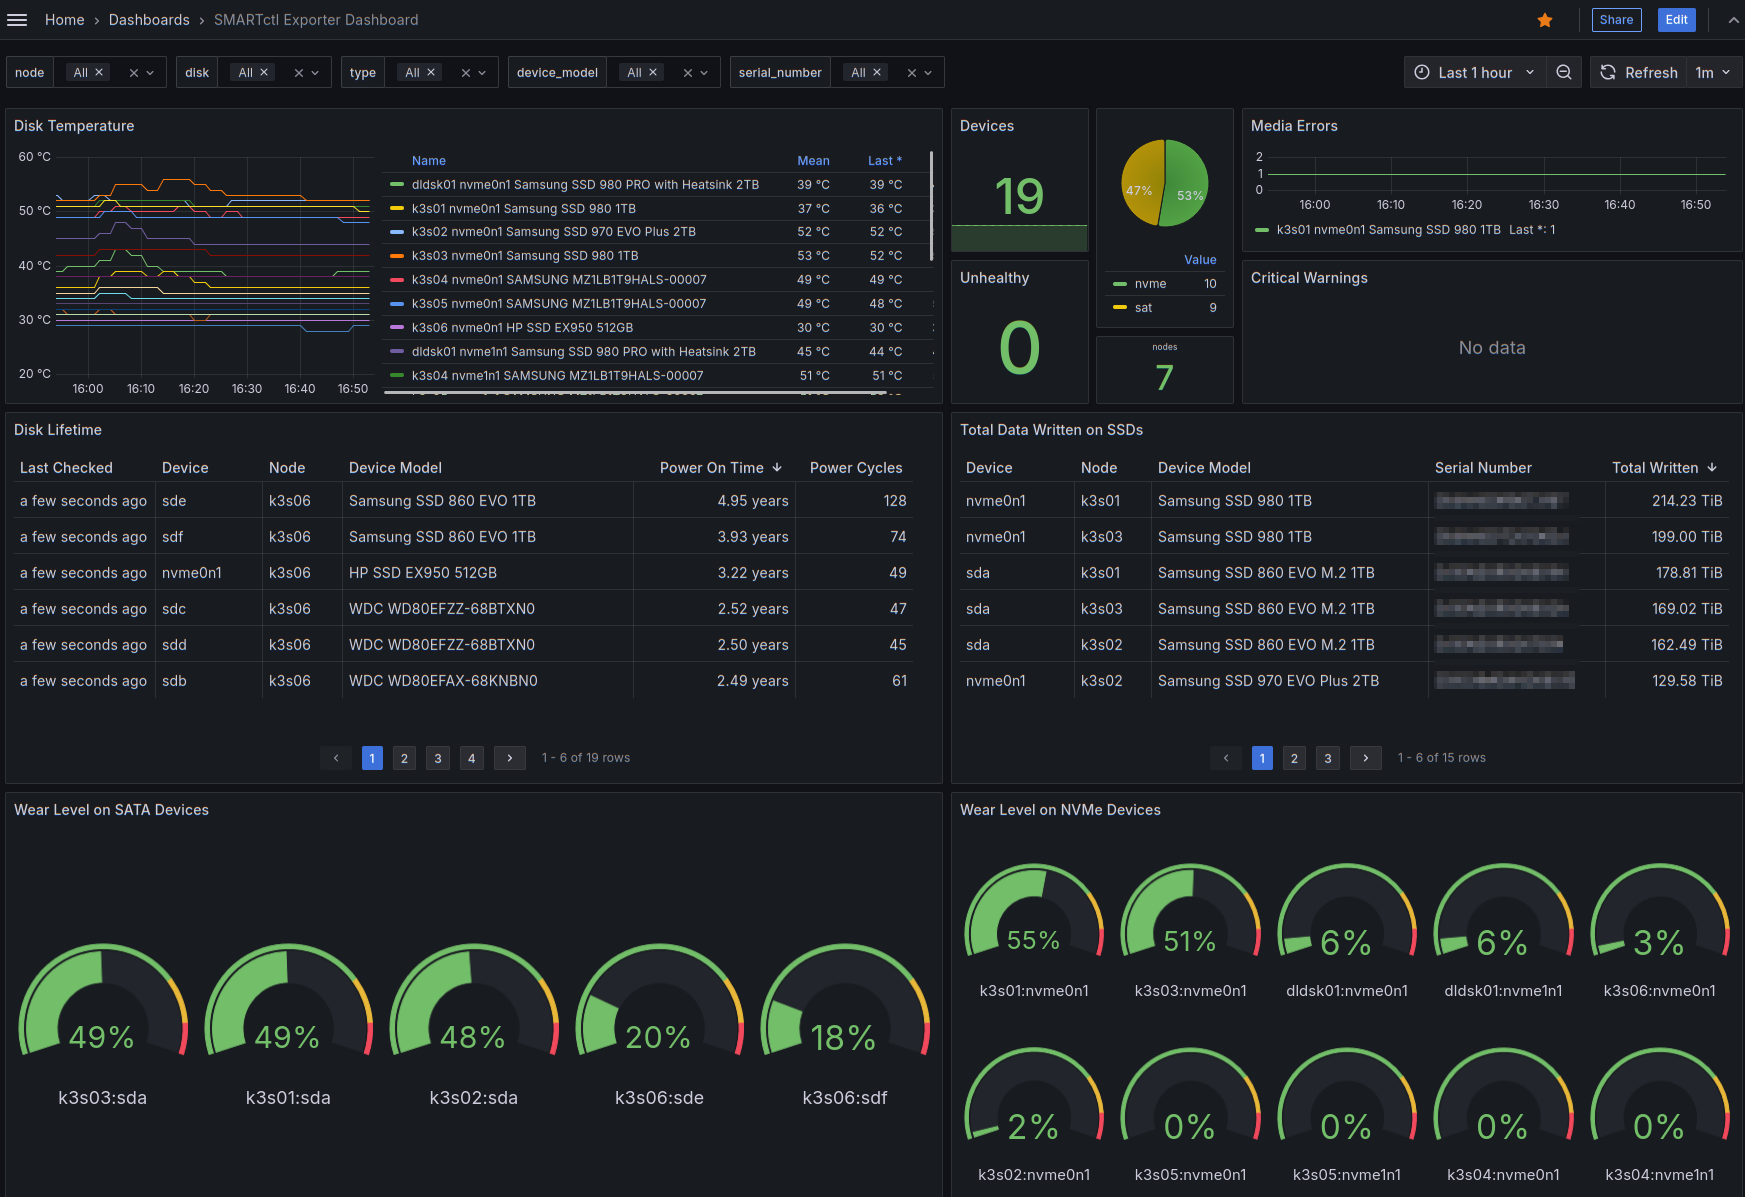
Used Metrics 1515
interface
model_family
model_name
serial_number
smartctl_device
smartctl_device_attribute
smartctl_device_block_size
smartctl_device_bytes_written
smartctl_device_critical_warning
smartctl_device_media_errors
smartctl_device_percentage_used
smartctl_device_power_cycle_count
smartctl_device_power_on_seconds
smartctl_device_smart_status
smartctl_device_temperature
Get Dashboard✕
Download
Copy to Clipboard