SLO / Detail 142,246142,246
5/2/2021
12/6/2021
5
>=8.3.0
Prometheus
Description
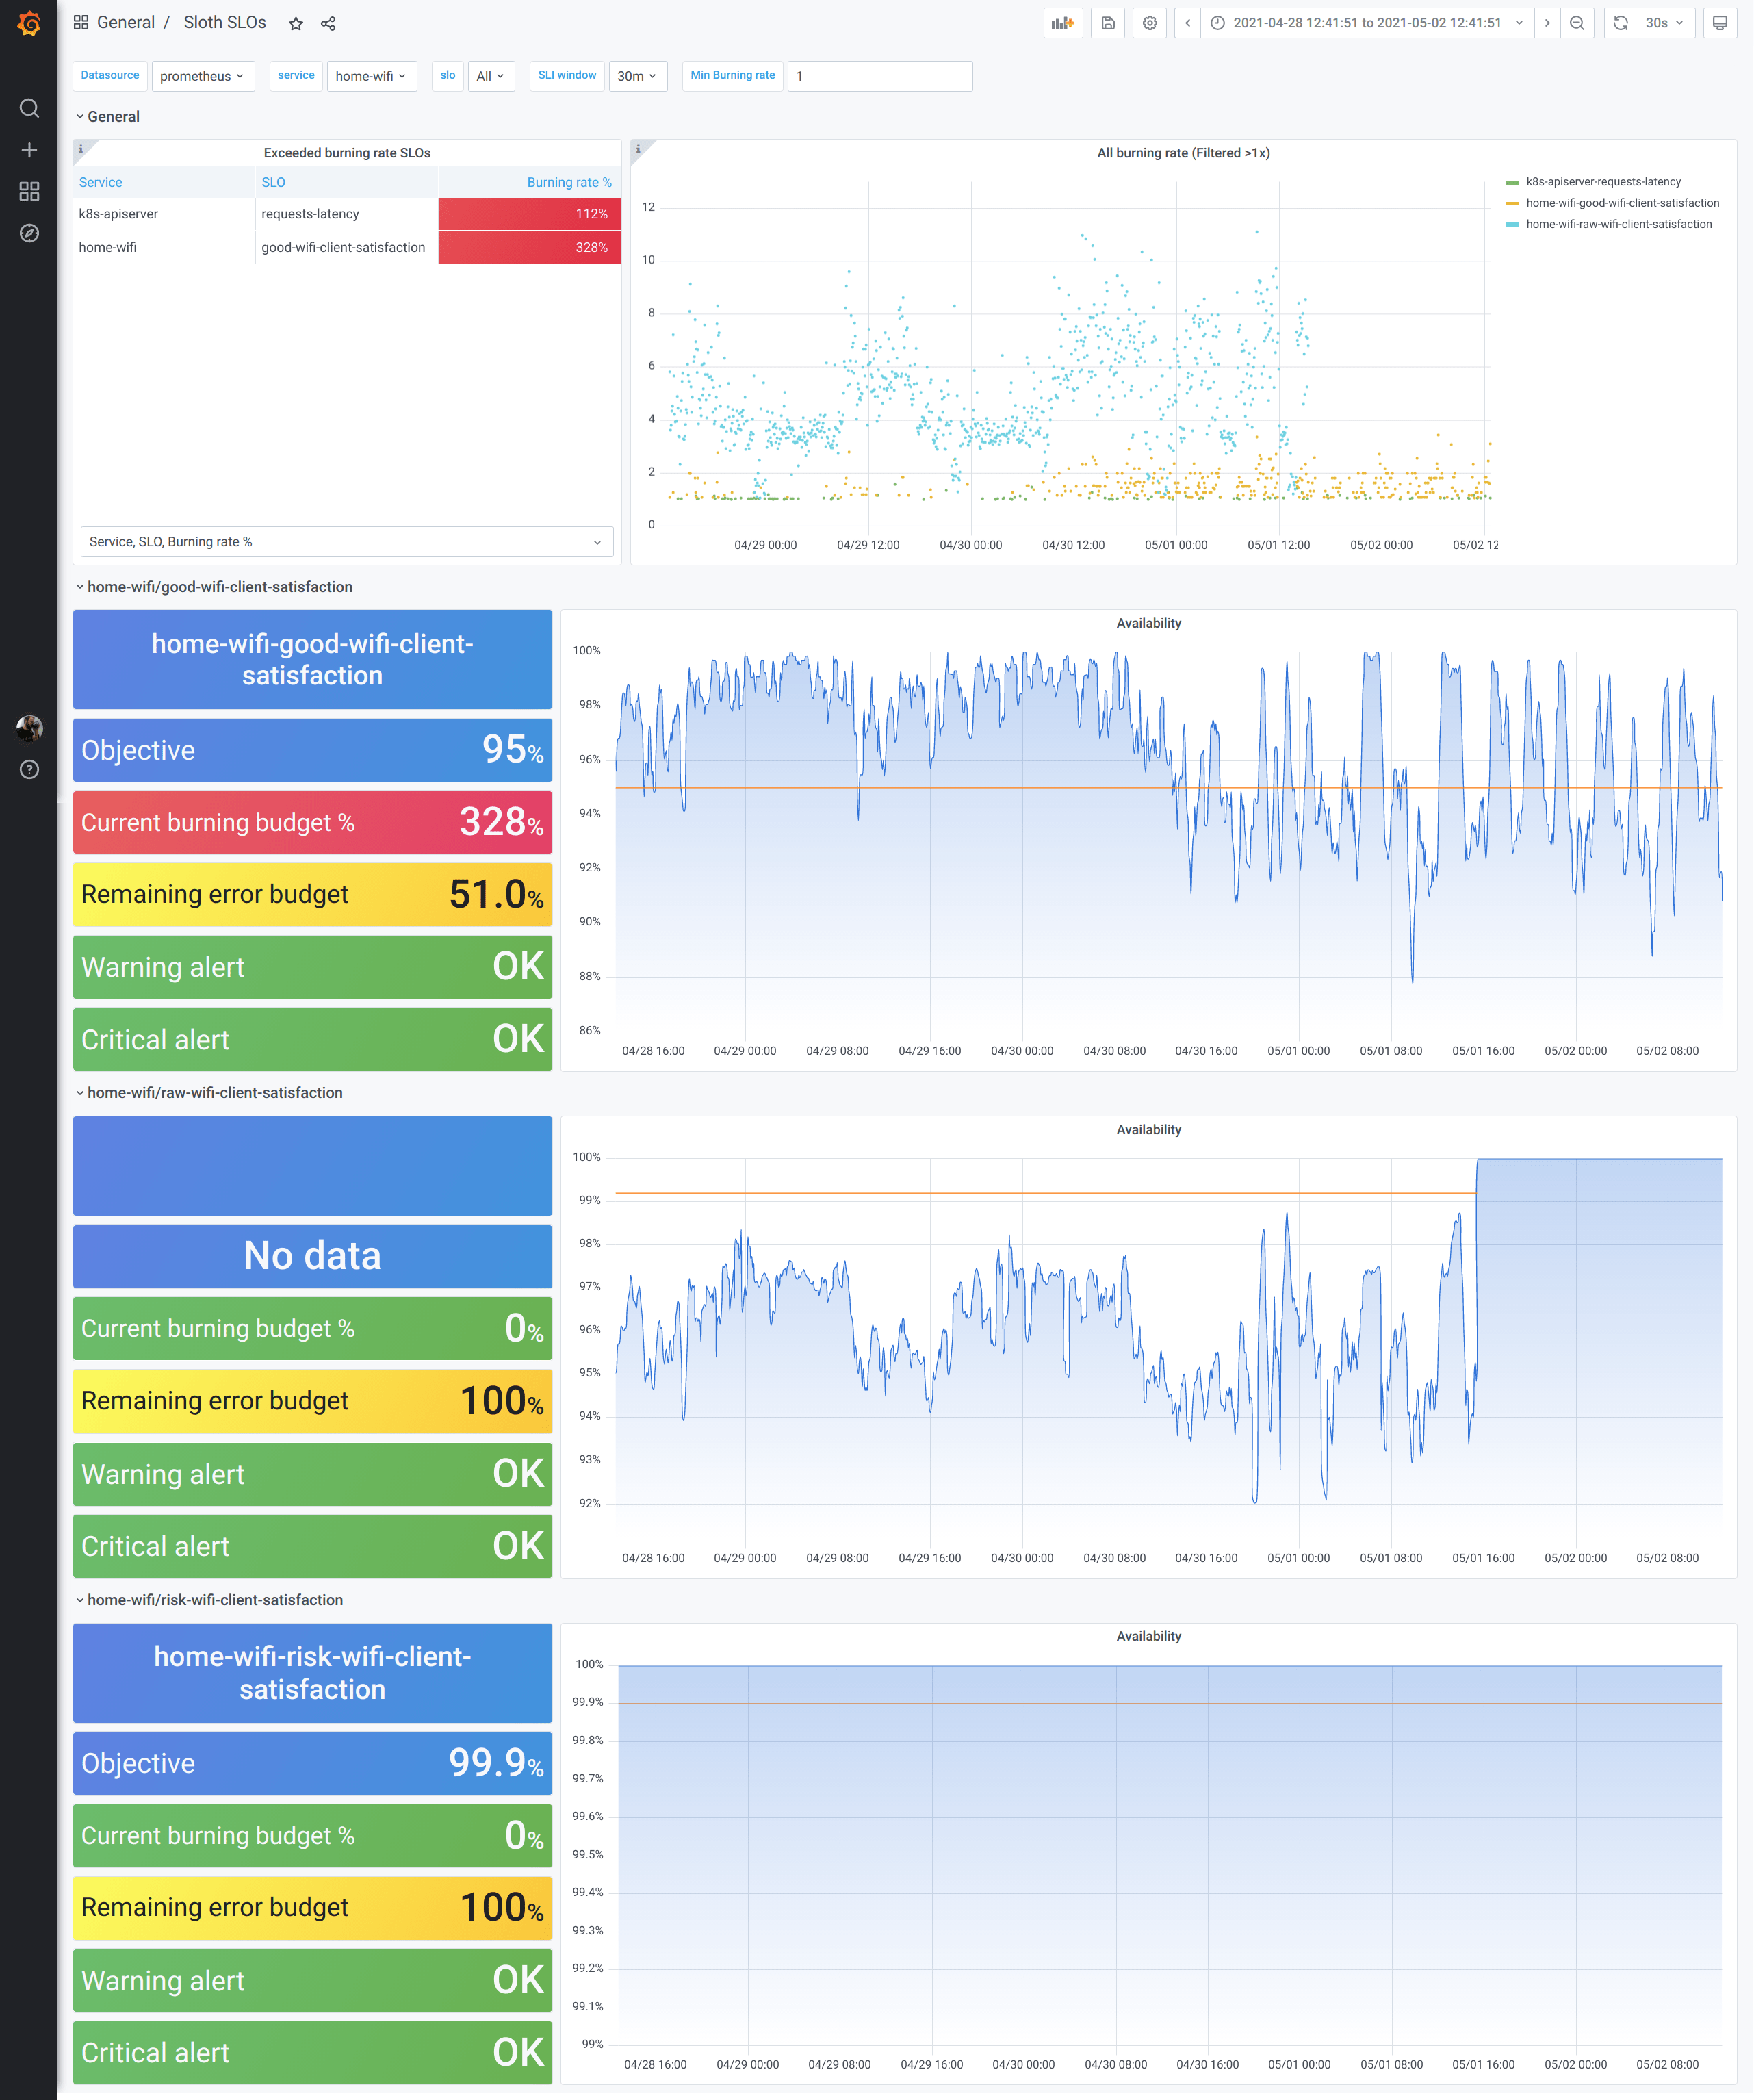
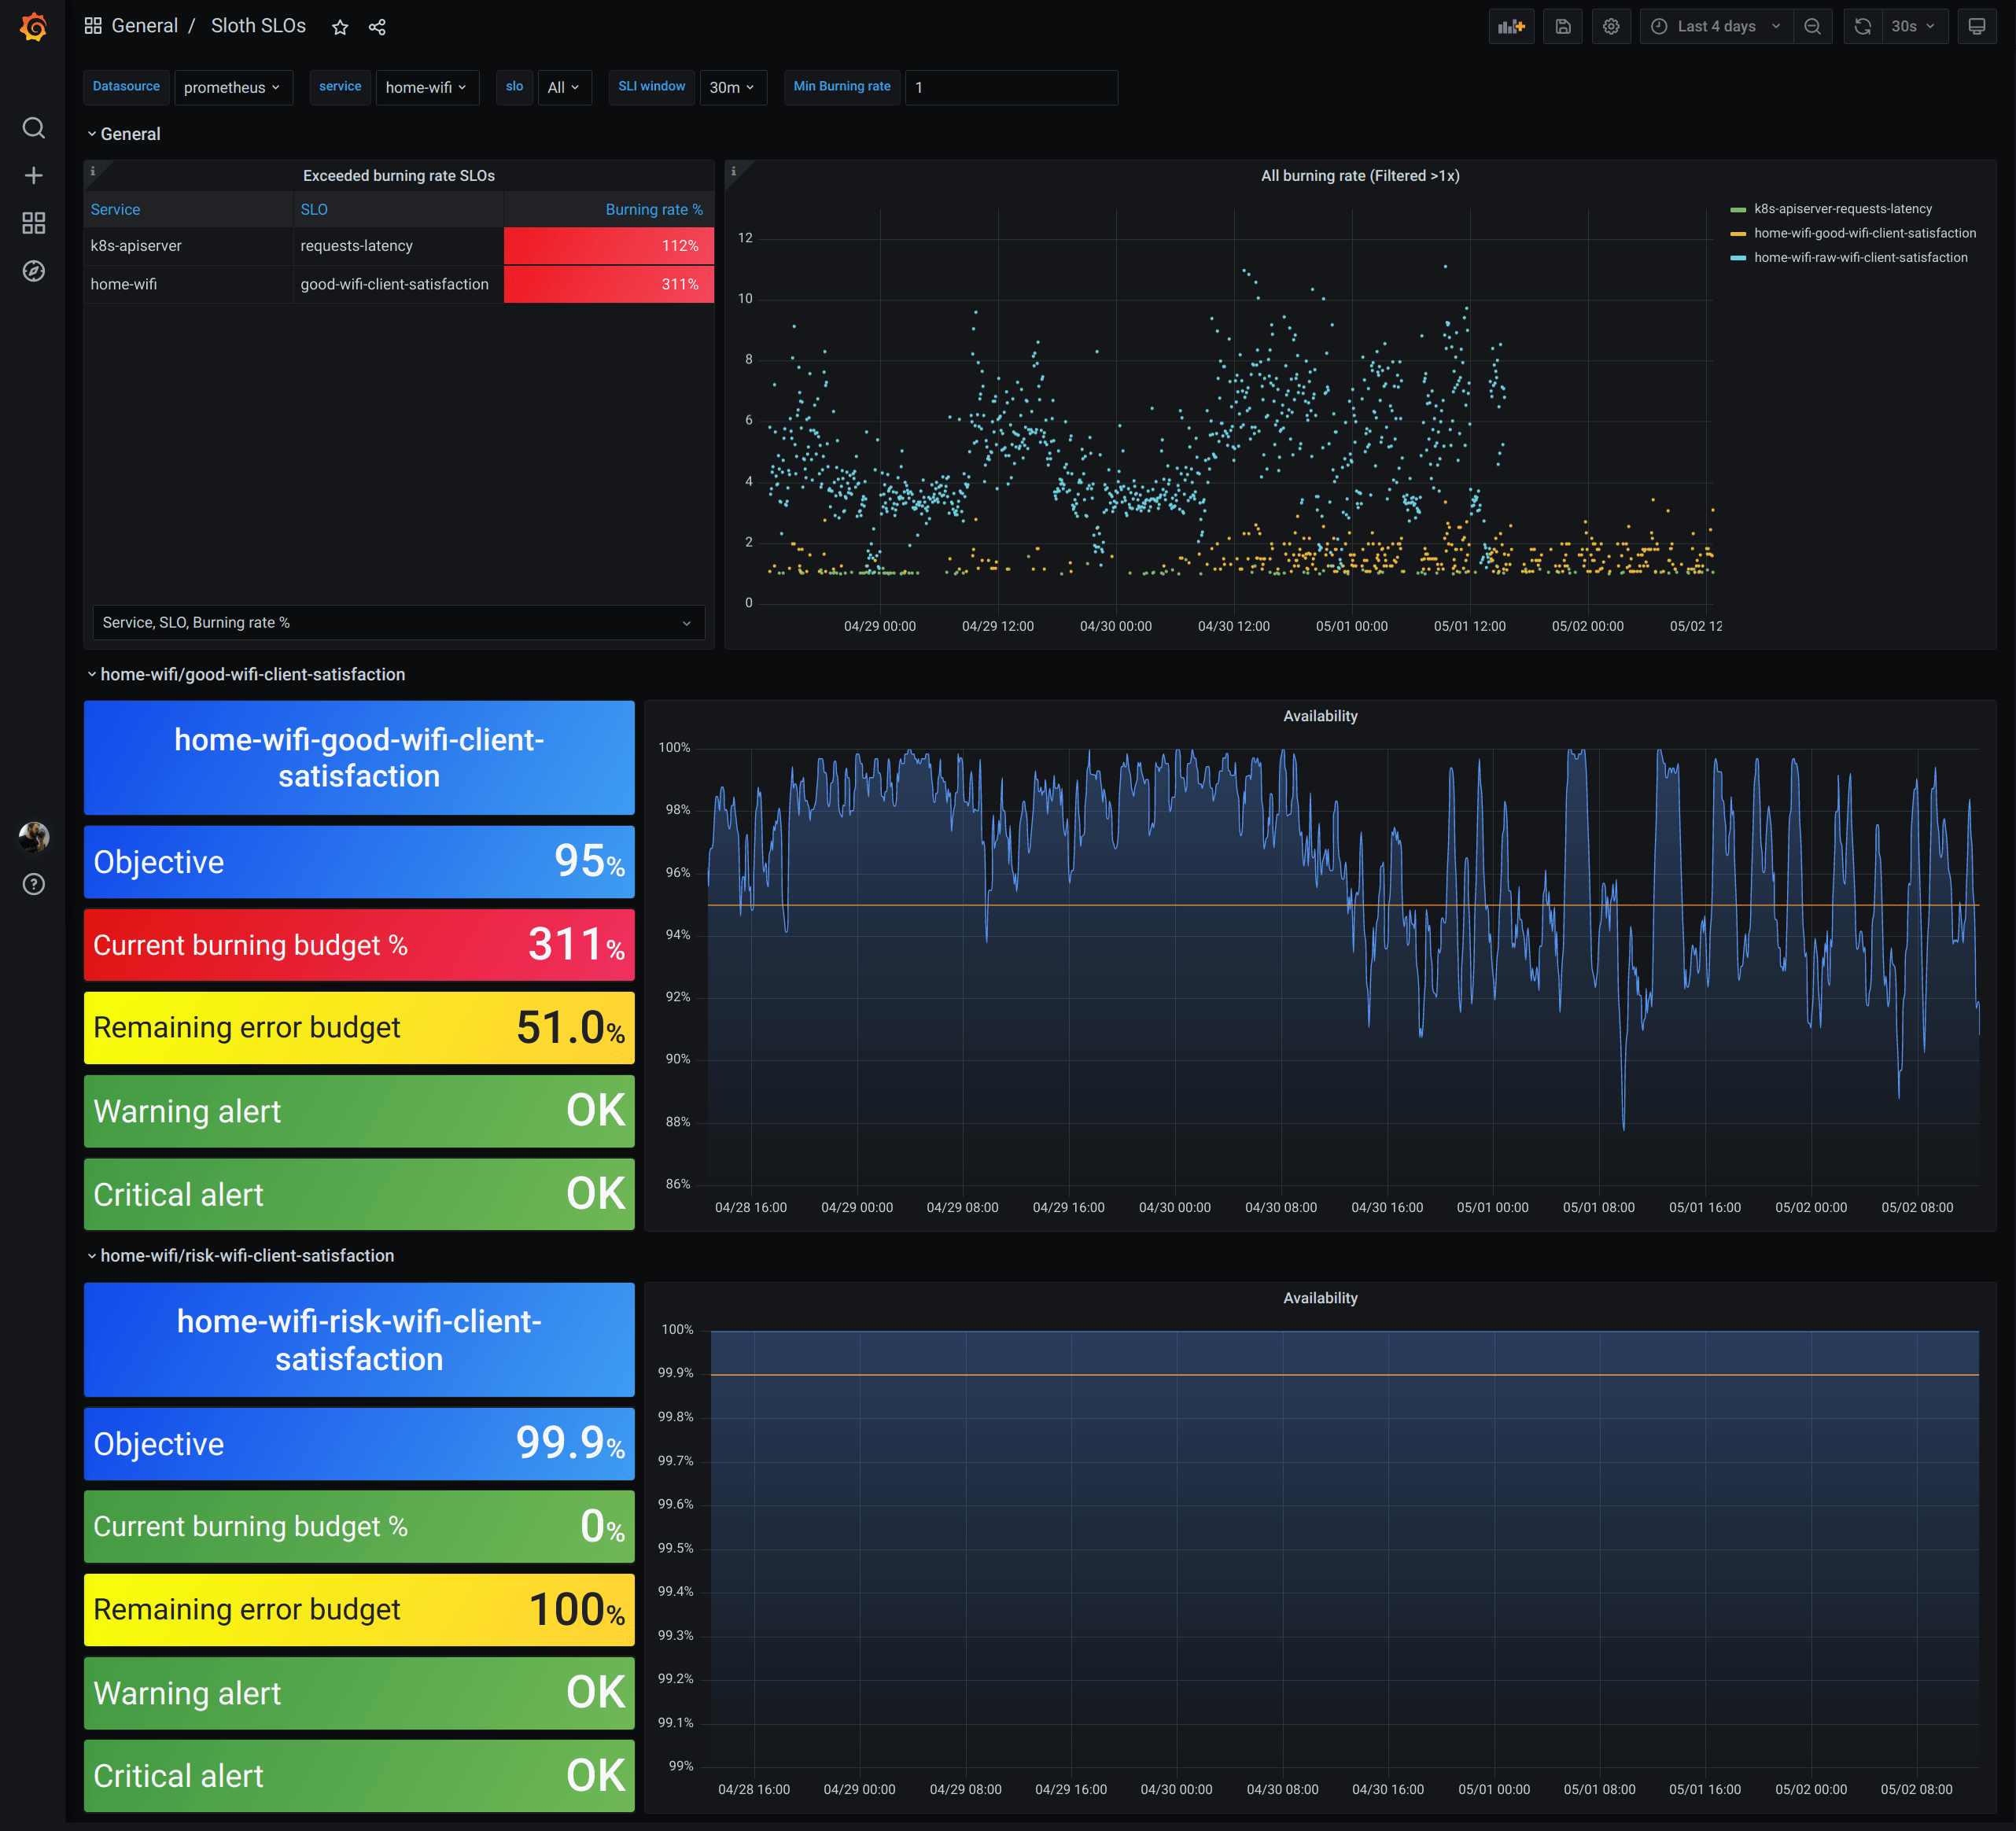
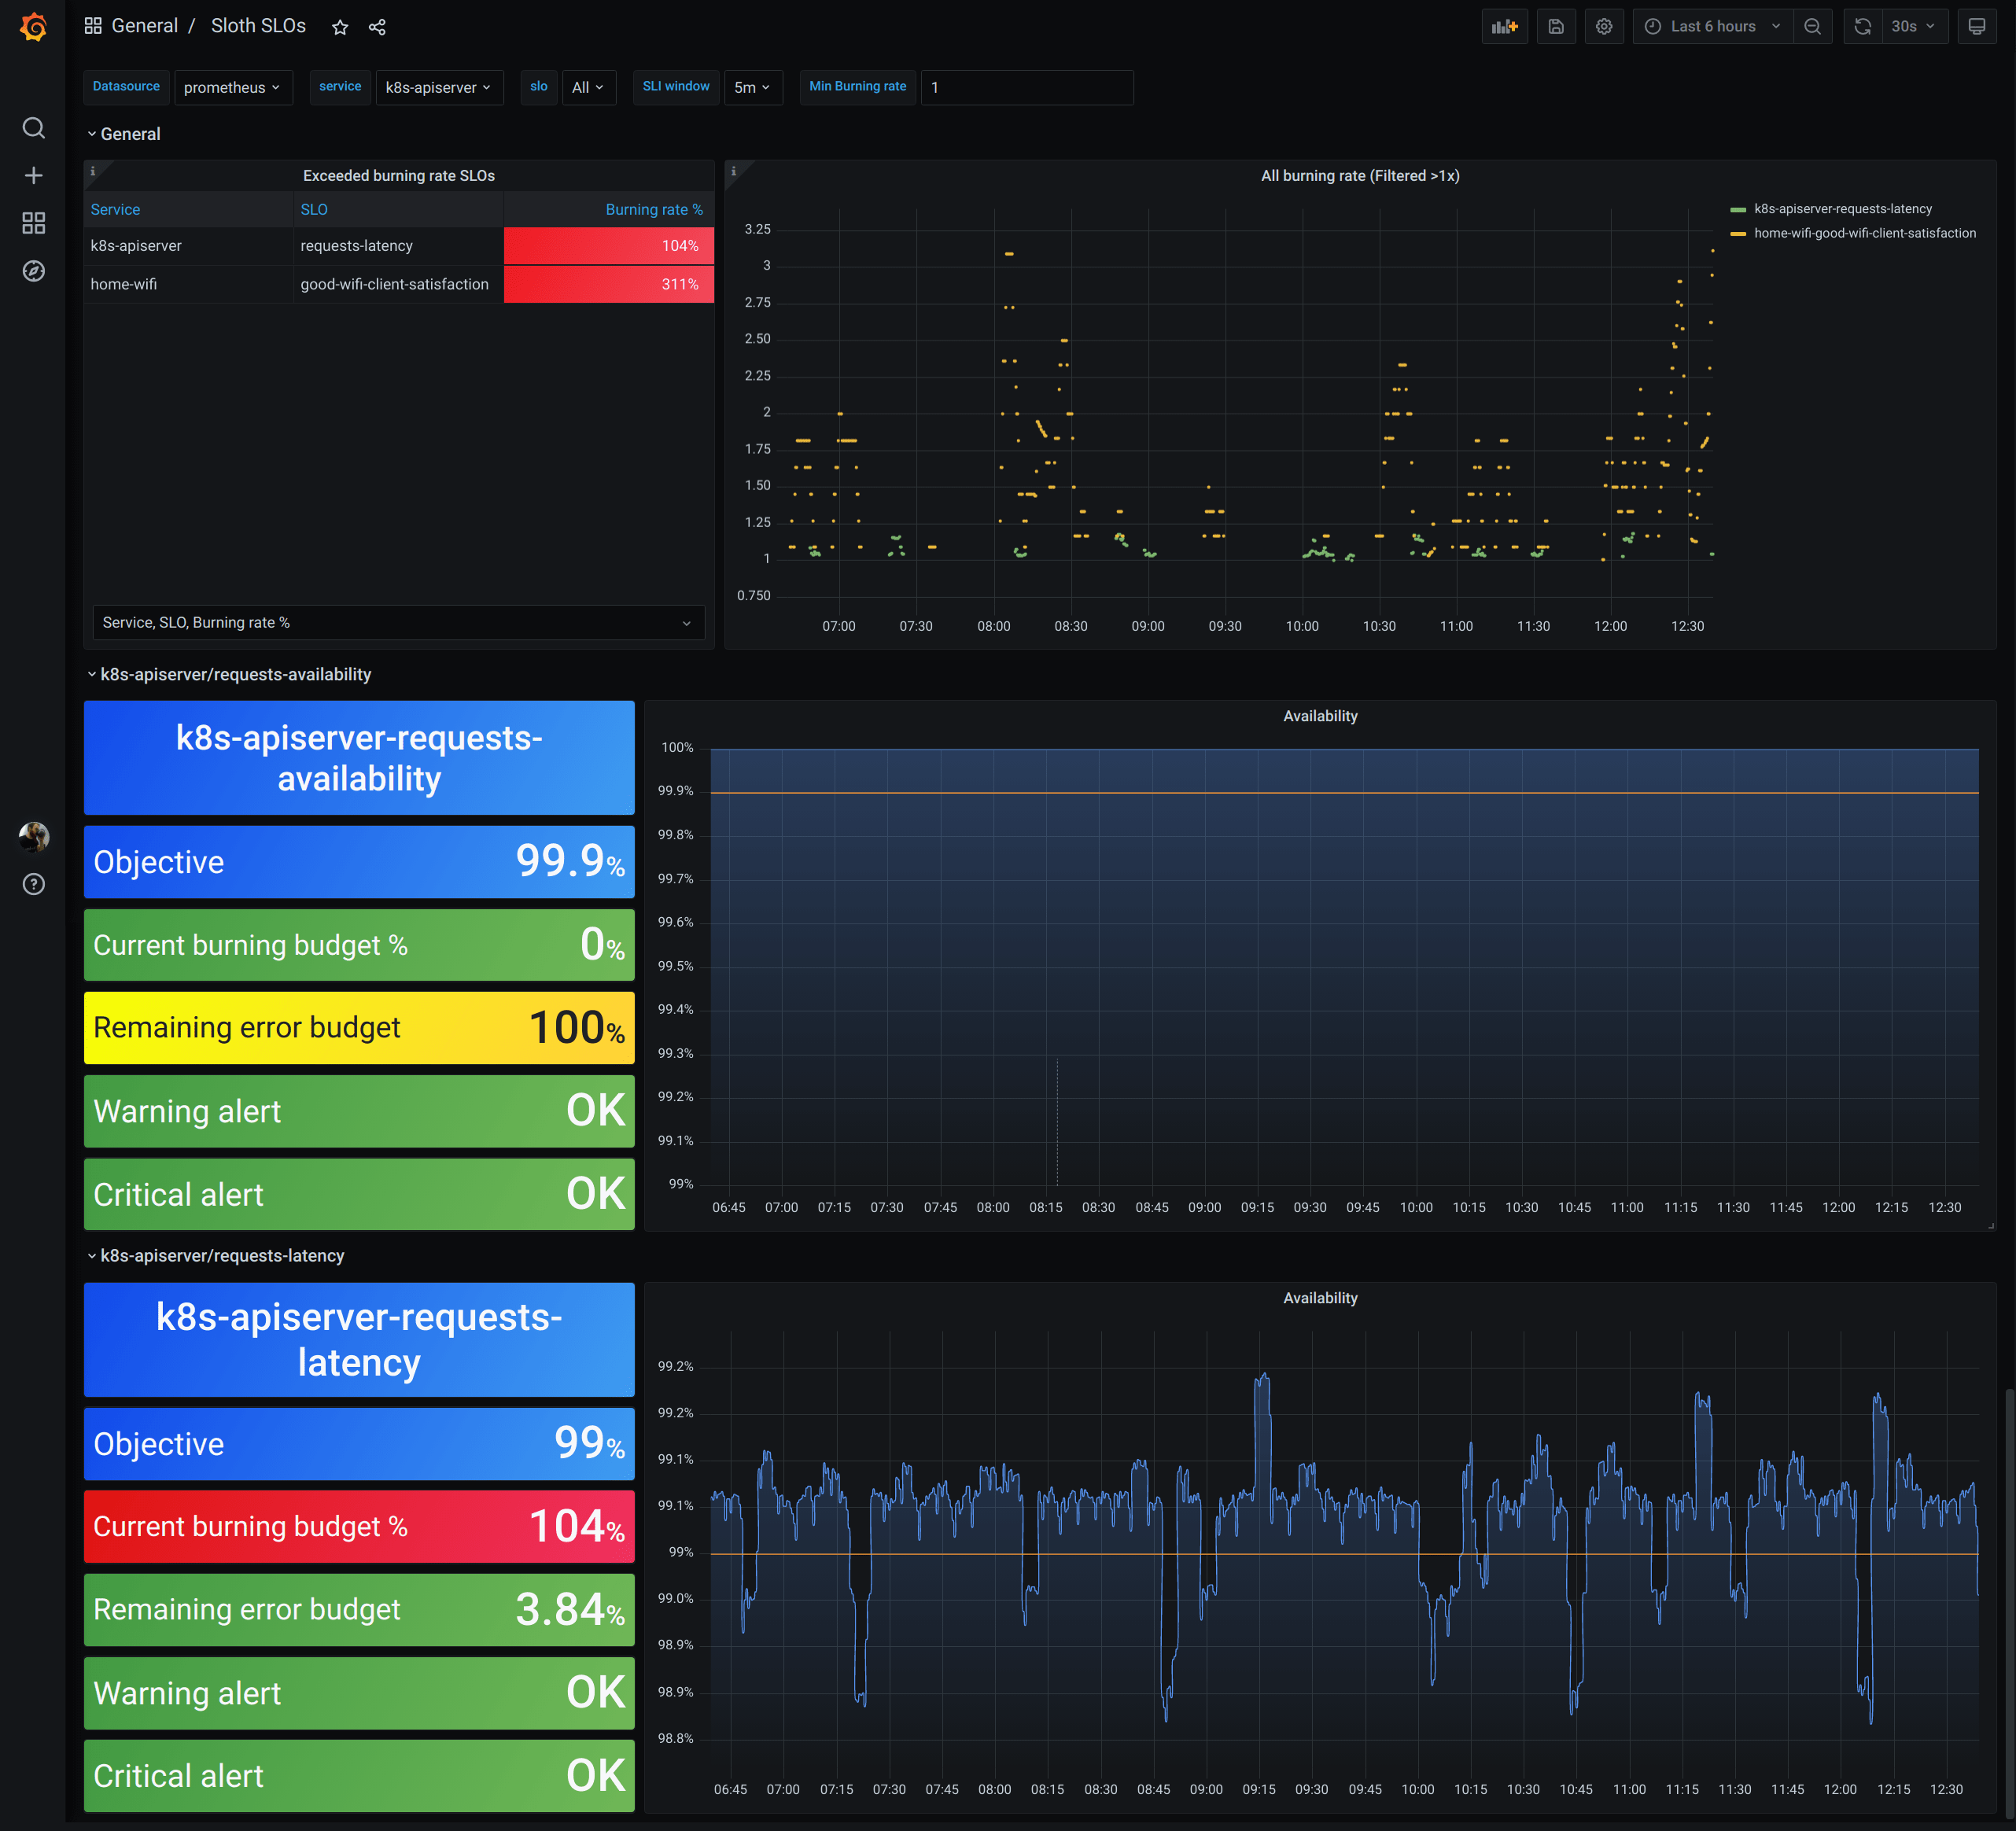
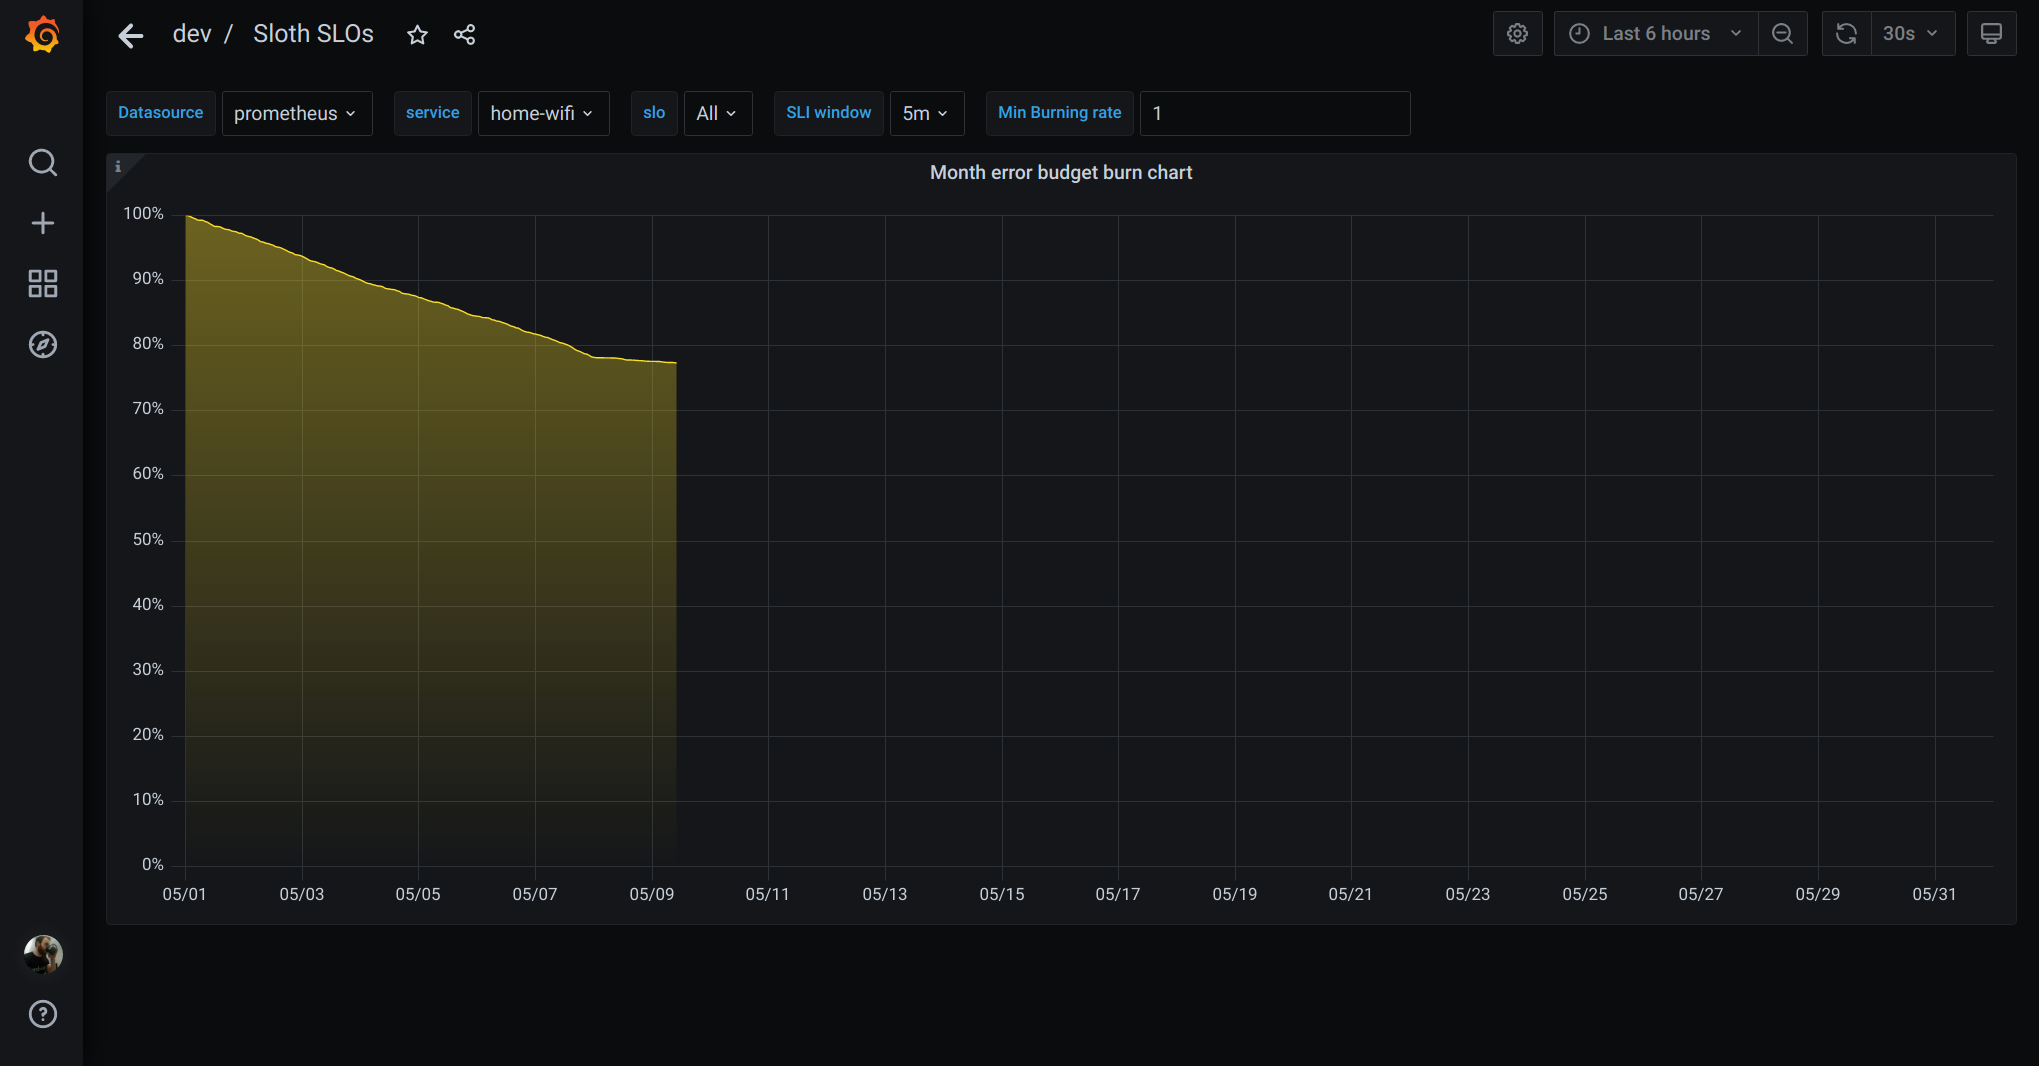
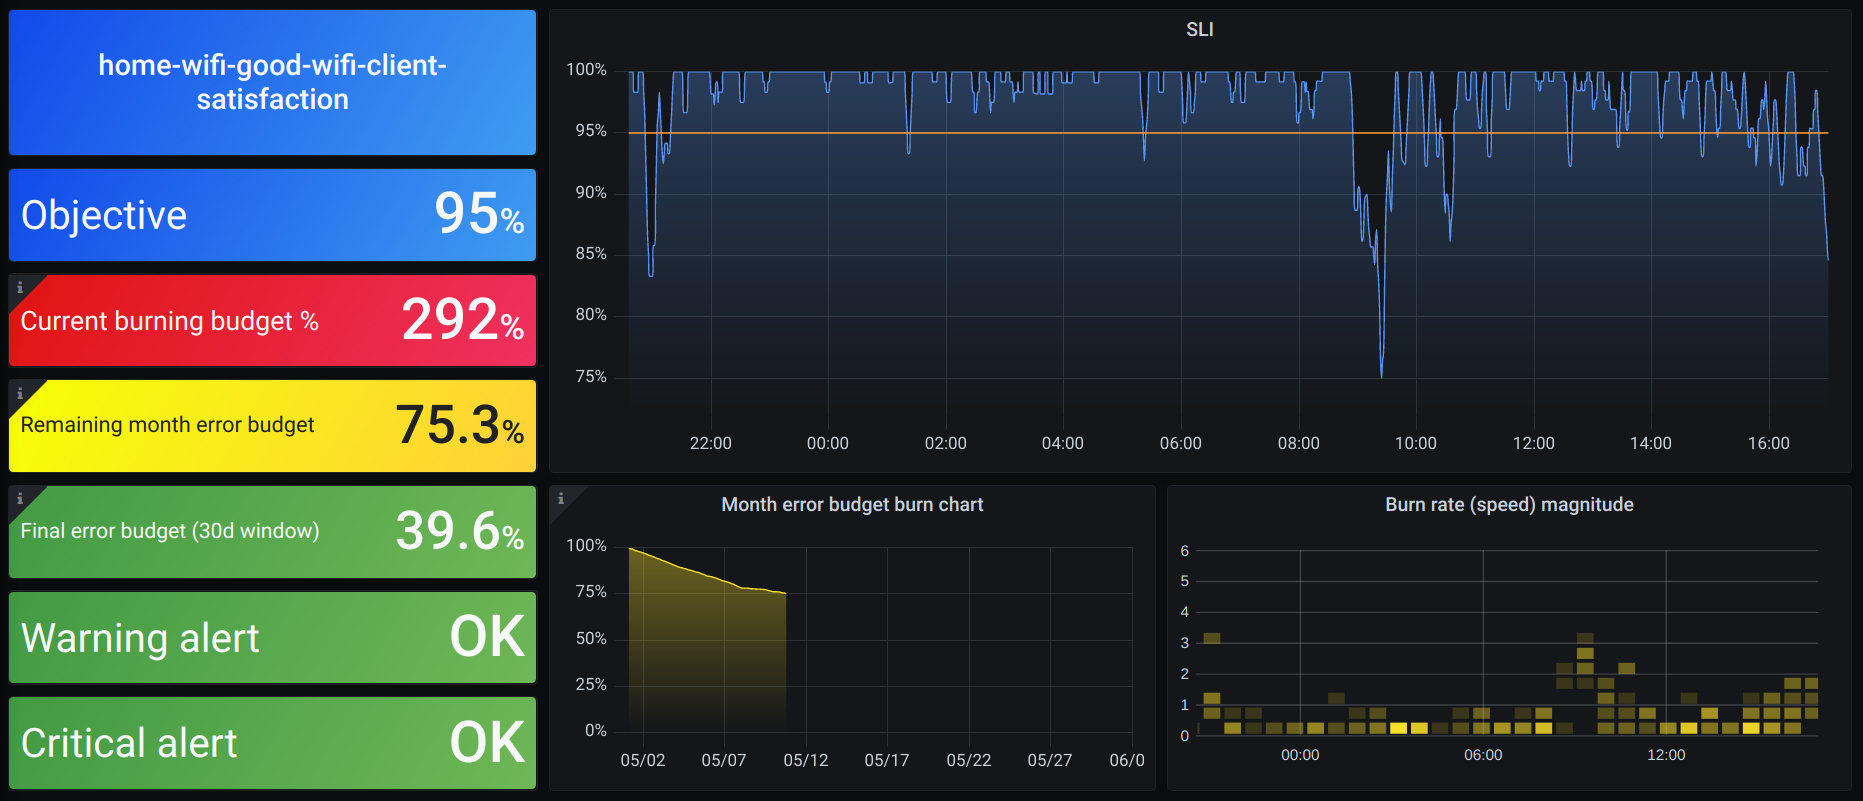
This dashboard monitors service reliability by tracking SLO burn rates and error budgets. It highlights critical trends such as slo:current_burn_rate:ratio relative to slo:objective:ratio, and displays the accumulated burn and remaining error budgets to quantify how fast the service is consuming its SLOs. Key features include a burn rate speed/magnitude view, an error budget burn chart, and an alerting panel (e.g., ALERTS and sloth_severity) to surface degraded performance and potential SLO breaches.
Screenshots
Used Metrics 1212
:
ALERTS
page
slo:current_burn_rate:ratio
slo:error_budget:ratio
slo:objective:ratio
slo:period_error_budget_remaining:ratio
slo:sli_error:ratio_rate
sloth_severity
sloth_slo
sloth_slo_info
ticket
Get Dashboard✕
Download
Copy to Clipboard