sFlow-RT Network Interfaces 824824
11/15/2019
8/9/2023
2
>=10.0.1
Prometheus
Description
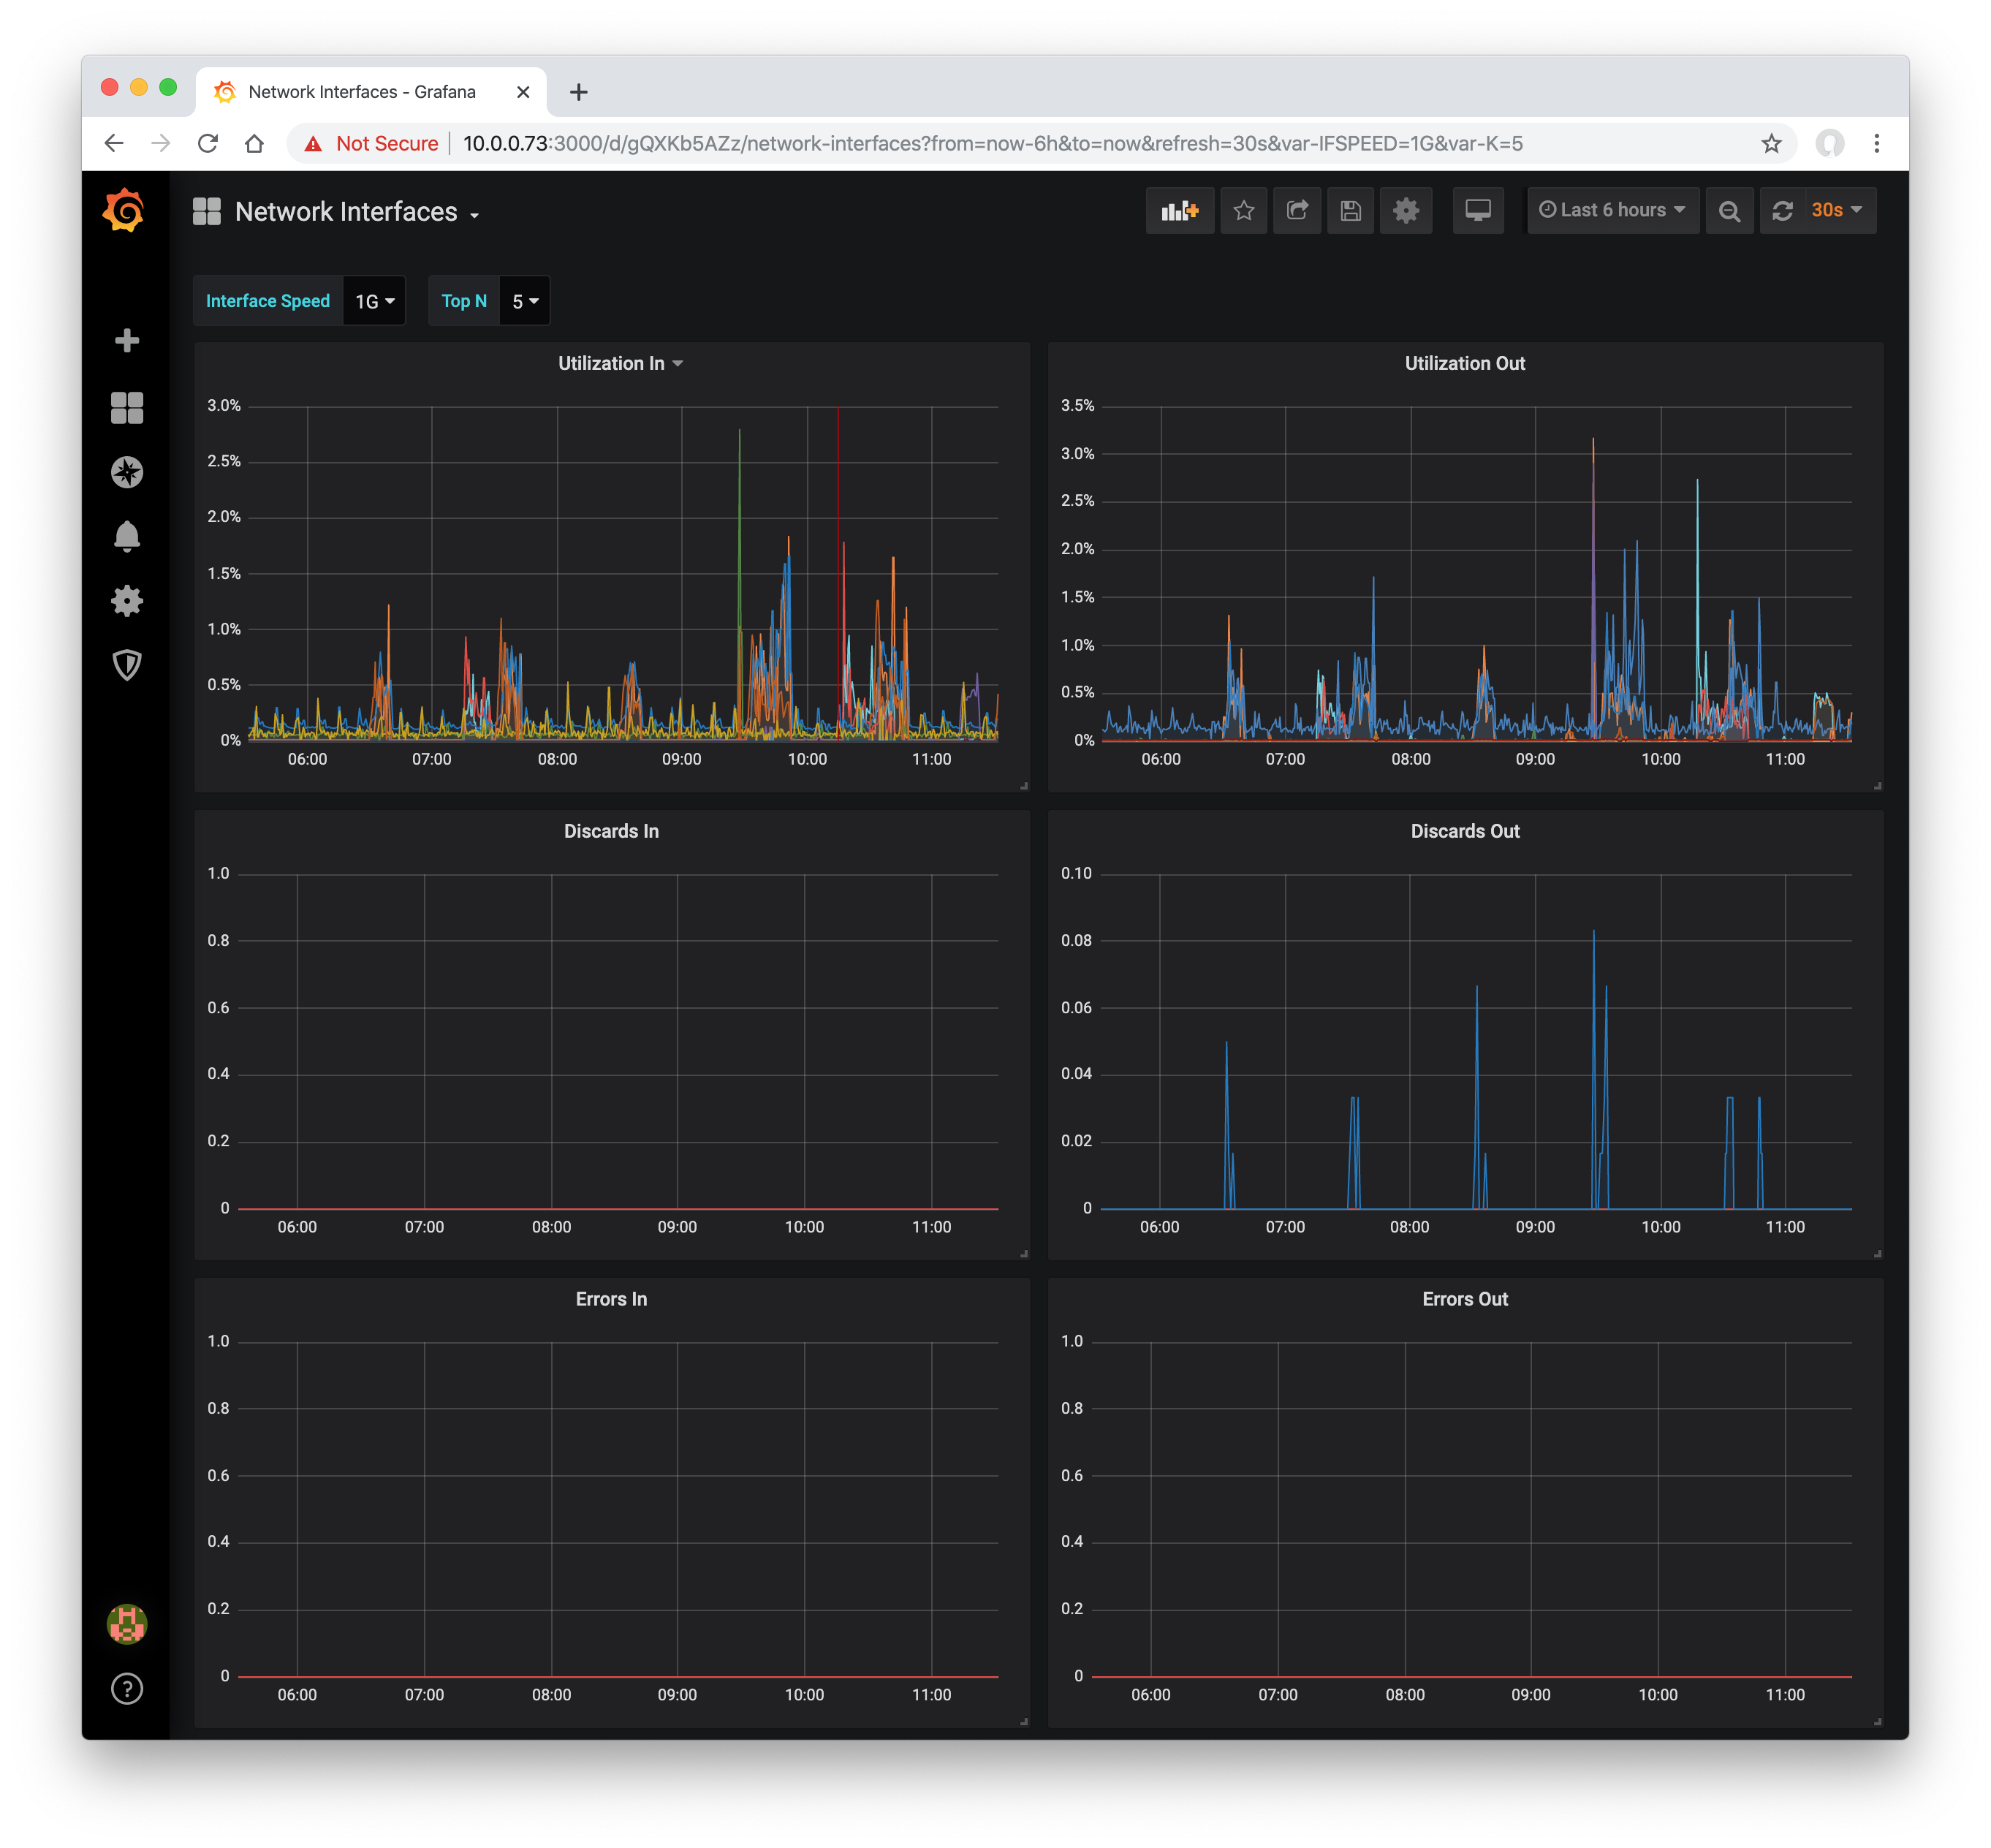
Busiest network interfaces based on sFlow telemetry
Screenshots
Used Metrics 66
sflow_ifindiscards
sflow_ifinerrors
sflow_ifinutilization
sflow_ifoutdiscards
sflow_ifouterrors
sflow_ifoututilization
Get Dashboard✕
Download
Copy to Clipboard