Service level (SLI/SLO) 3,3553,355
11/4/2018
11/4/2018
1
>=5.3.2
Prometheus
Description
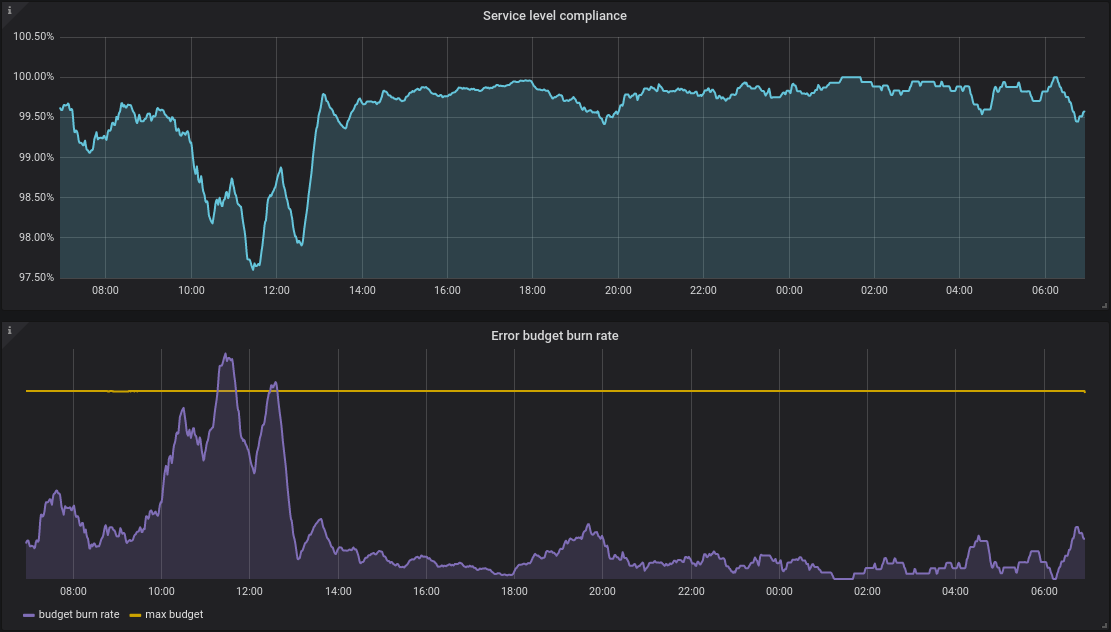
Service level dashboard with availability and error budgets based on the Kubernetes service-lebel-operator
Screenshots
Used Metrics 44
service_level_sli_result_count_total
service_level_sli_result_error_ratio_total
service_level_slo_objective_ratio
slo
Get Dashboard✕
Download
Copy to Clipboard