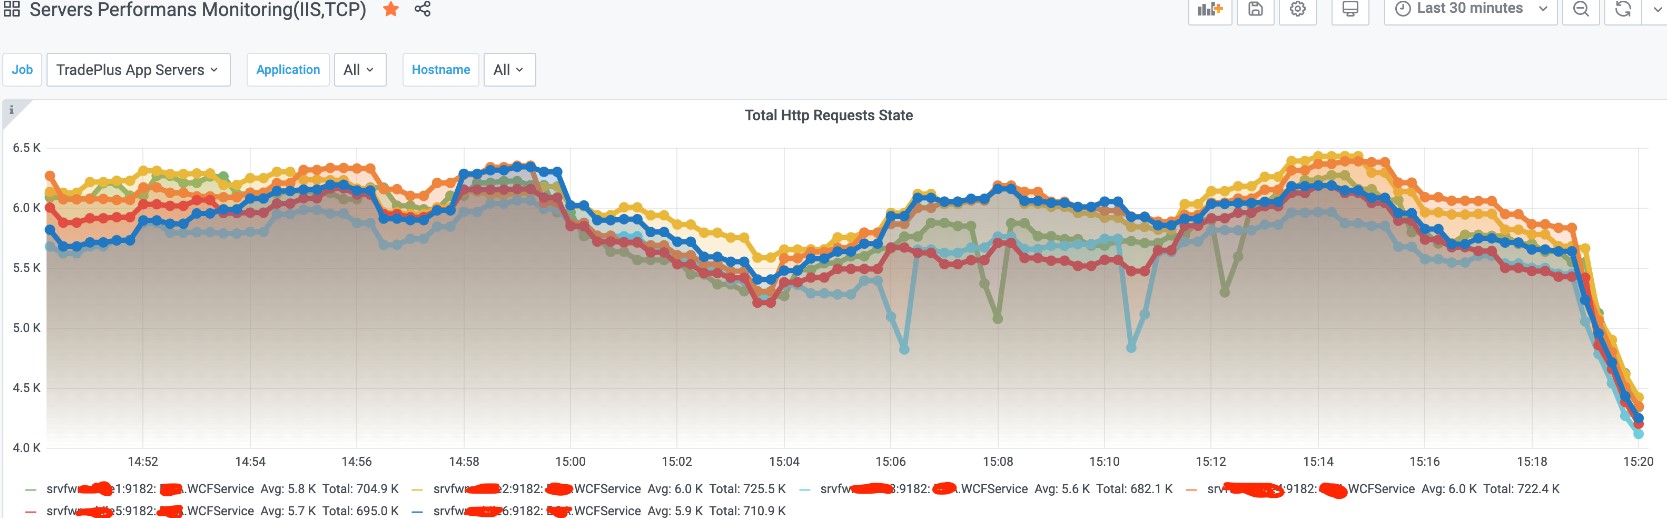
Servers Performance Monitoring(IIS,TCP Connections) 1,1121,112 5.0 (2 reviews)
12/18/2020
11/20/2023
1
>=7.3.6
Prometheus
Description
Basic overview of windows host metrics, based on WMI Exporter (v0.14.0)
Screenshots
Used Metrics 1010
windows_iis_anonymous_users_total
windows_iis_connection_attempts_all_instances_total
windows_iis_worker_request_errors_total
windows_iis_worker_requests_total
windows_netframework_clrexceptions_exceptions_thrown_total
windows_tcp_connection_failures
windows_tcp_connections_active
windows_tcp_connections_established
windows_tcp_connections_passive
windows_tcp_connections_reset
Get Dashboard✕
Download
Copy to Clipboard