S.M.A.R.T disk monitoring for Prometheus Errorboard (DEPRECATED) 1,3101,310 2.0 (1 reviews)
7/14/2019
8/31/2024
1
Host Metrics
>=6.2.5
Prometheus
Description
Smartmon Texfile node_exporter Dashboard
Extends the following dashboard:
Screenshots
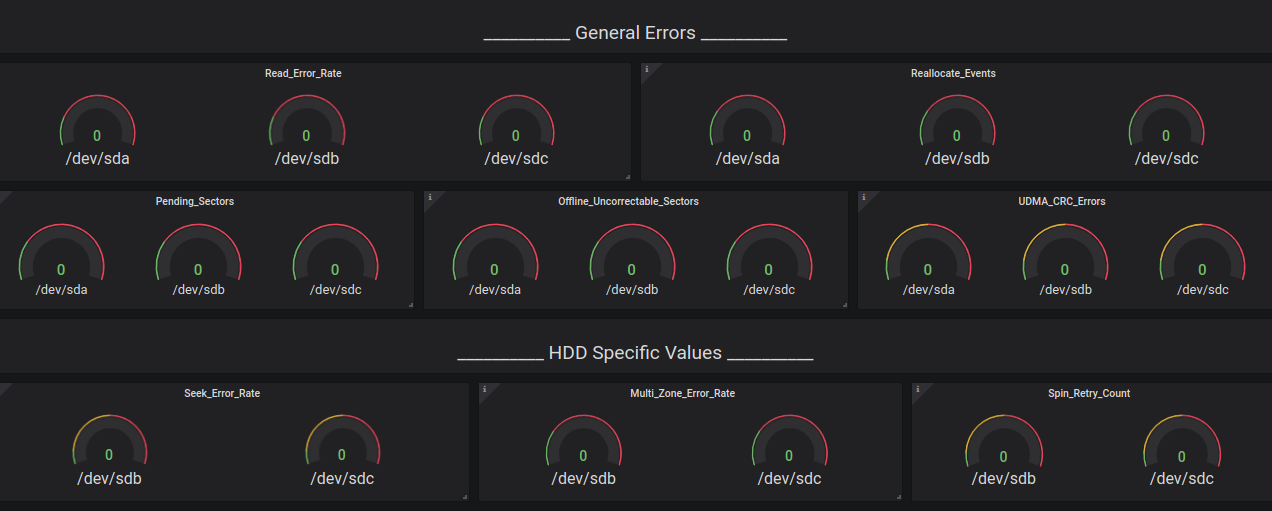
Used Metrics 88
smartmon_current_pending_sector_raw_value
smartmon_multi_zone_error_rate_raw_value
smartmon_offline_uncorrectable_raw_value
smartmon_raw_read_error_rate_raw_value
smartmon_reallocated_event_count_raw_value
smartmon_seek_error_rate_raw_value
smartmon_spin_retry_count_raw_value
smartmon_udma_crc_error_count_raw_value
Get Dashboard✕
Download
Copy to Clipboard