S.M.A.R.T disk monitoring for Prometheus Dashboard 5,2925,292 1.0 (1 reviews)
Description
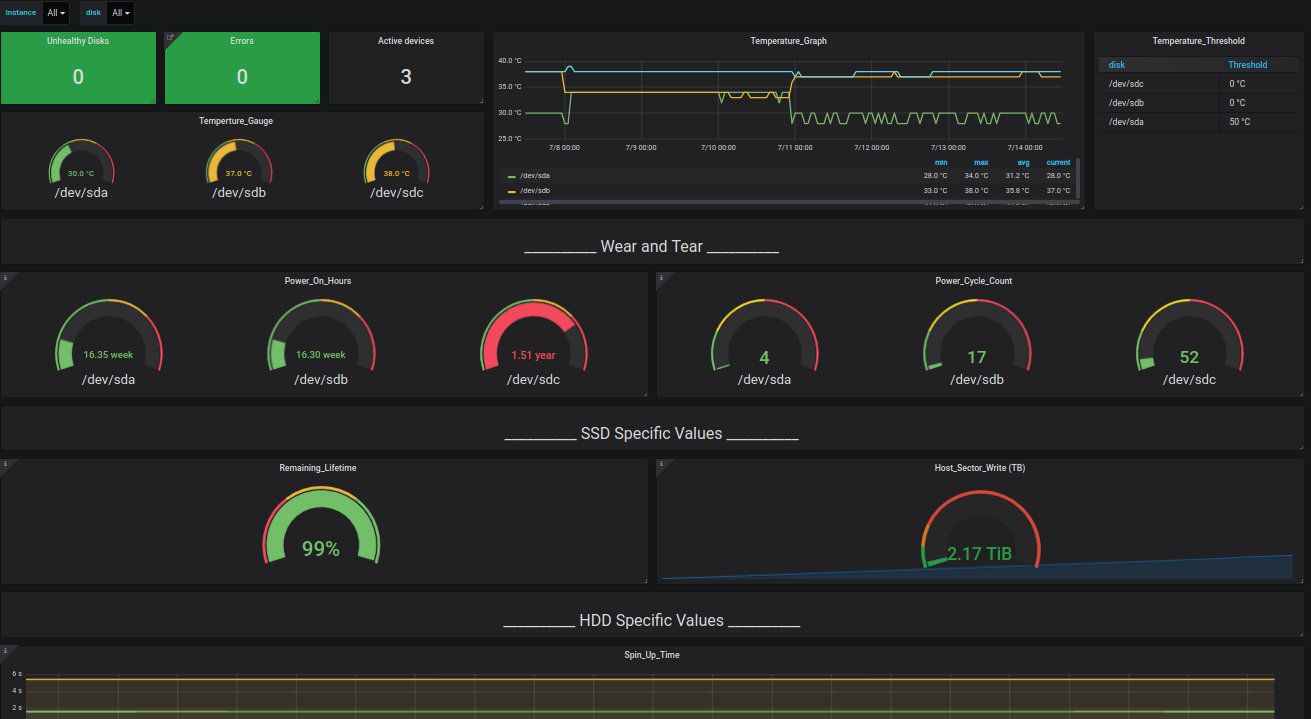
Smartmon Texfile node_exporter Dashboard
Screenshots
Used Metrics 2525
smartmon_current_pending_sector_raw_value
smartmon_device_active
smartmon_device_info
smartmon_device_smart_healthy
smartmon_load_cycle_count_raw_value
smartmon_multi_zone_error_rate_raw_value
smartmon_offline_uncorrectable_raw_value
smartmon_percent_lifetime_remain_raw_value
smartmon_power_cycle_count_raw_value
smartmon_power_cycles
smartmon_power_off_retract_count_raw_value
smartmon_power_on_hours
smartmon_power_on_hours_raw_value
smartmon_raw_read_error_rate_raw_value
smartmon_reallocate_nand_blk_cnt_raw_value
smartmon_reallocated_event_count_raw_value
smartmon_reallocated_sector_ct_raw_value
smartmon_seek_error_rate_raw_value
smartmon_spin_retry_count_raw_value
smartmon_spin_up_time_raw_value
smartmon_start_stop_count_raw_value
smartmon_temperature
smartmon_temperature_celsius_raw_value
smartmon_udma_crc_error_count_raw_value
smartmon_written_bytes