S.M.A.R.T Dashboard 2,3842,384 4.0 (2 reviews)
Description
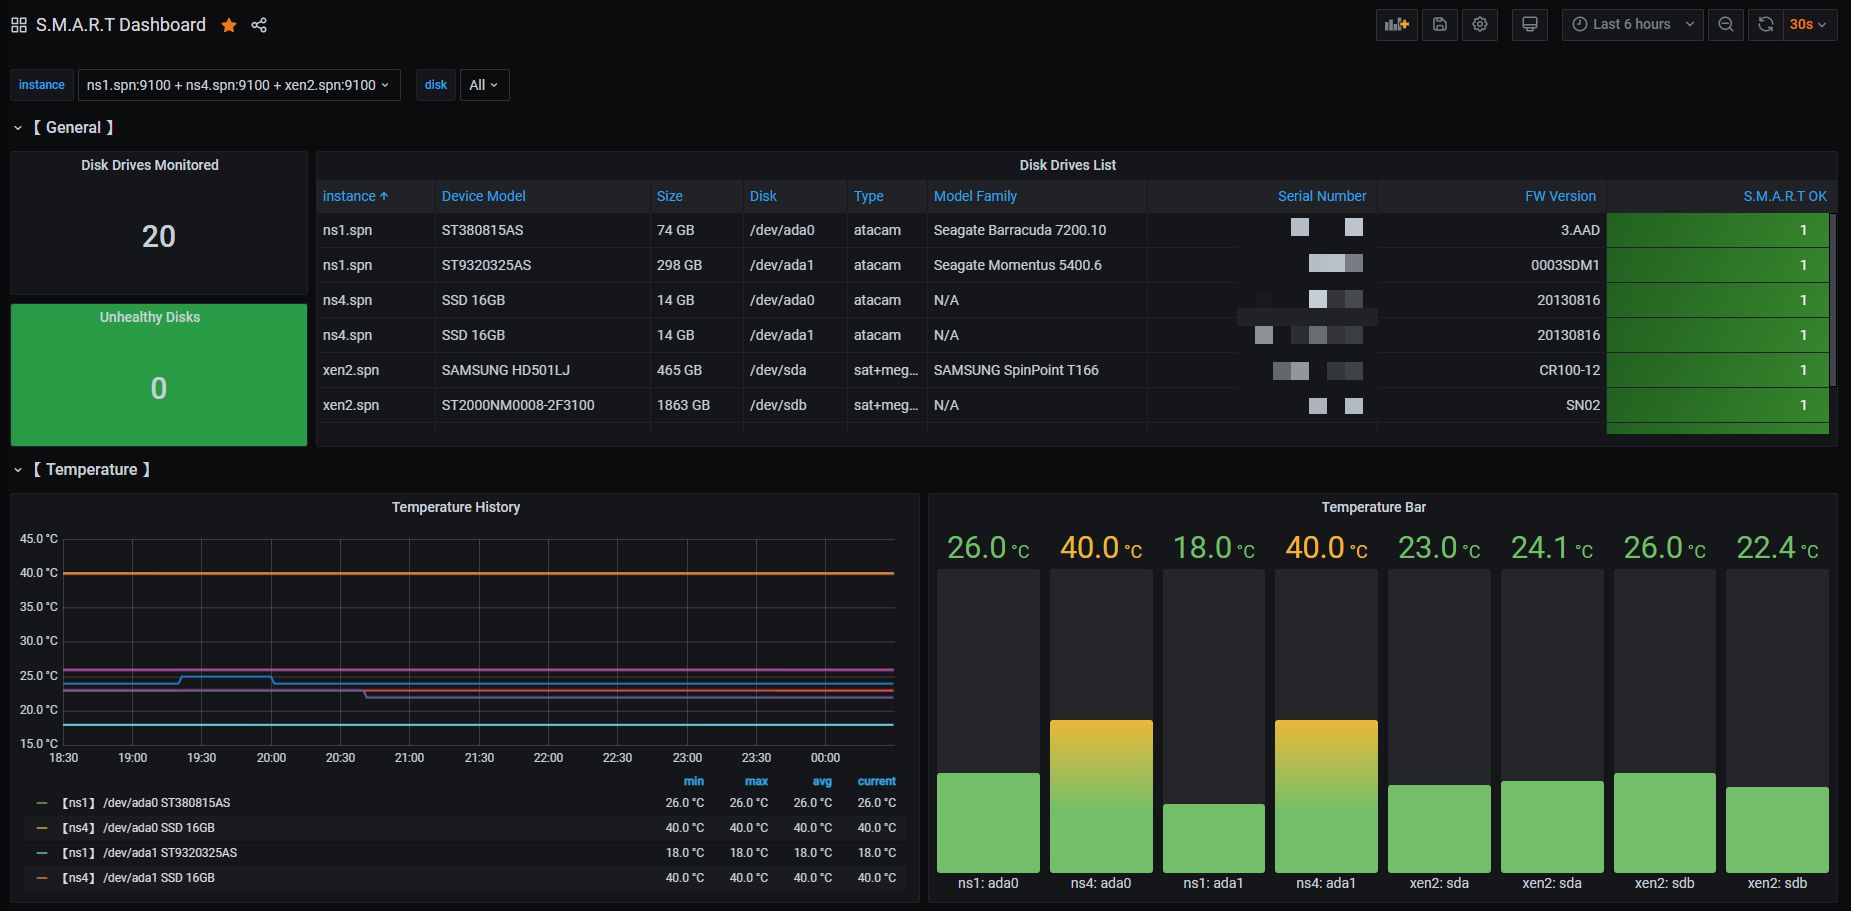
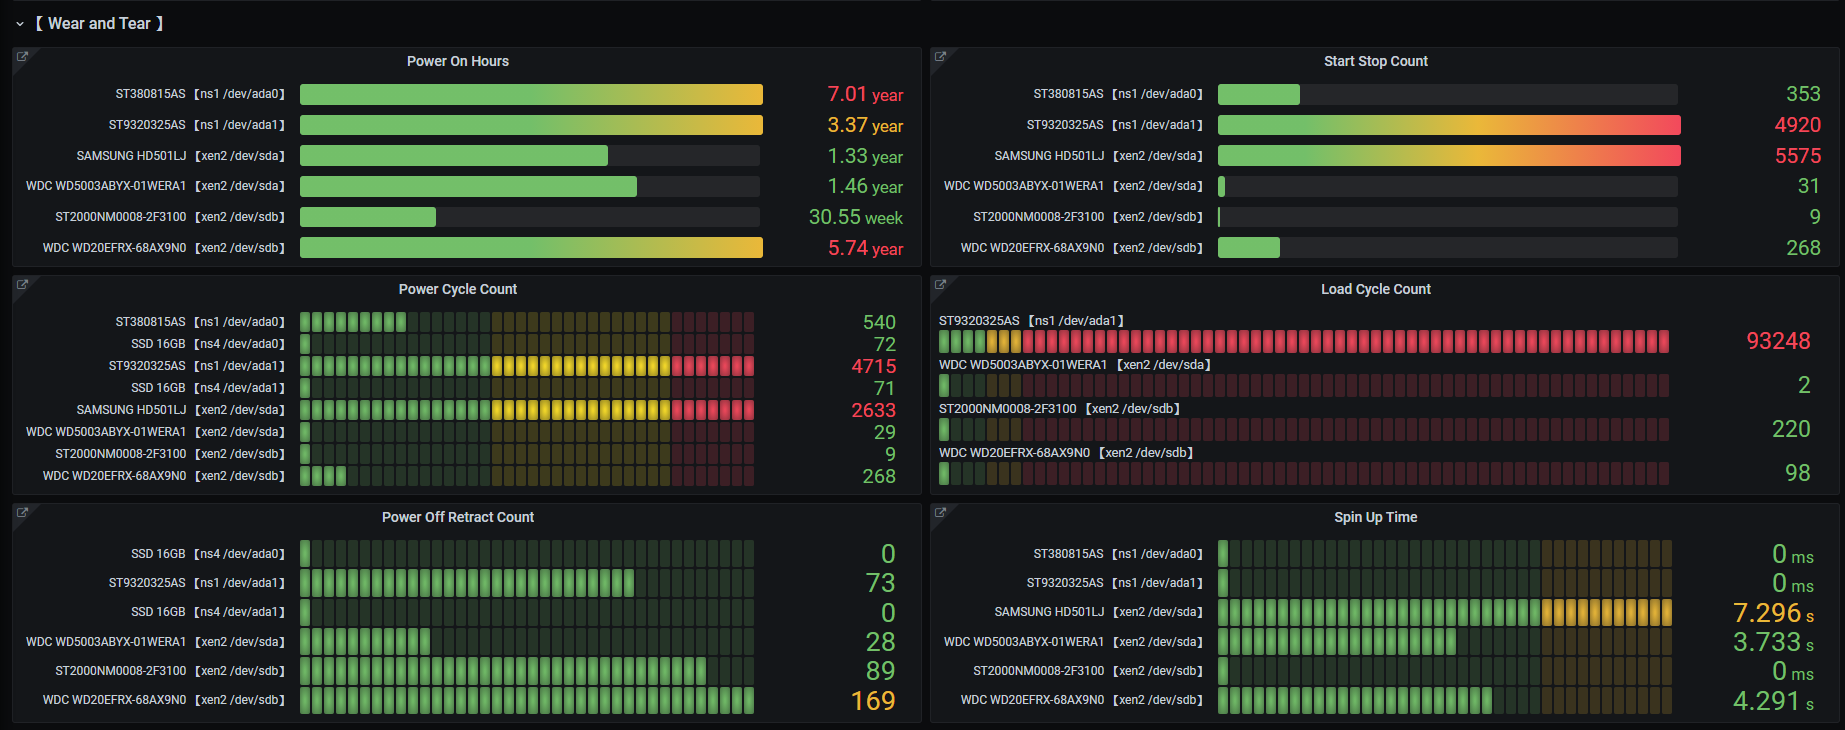
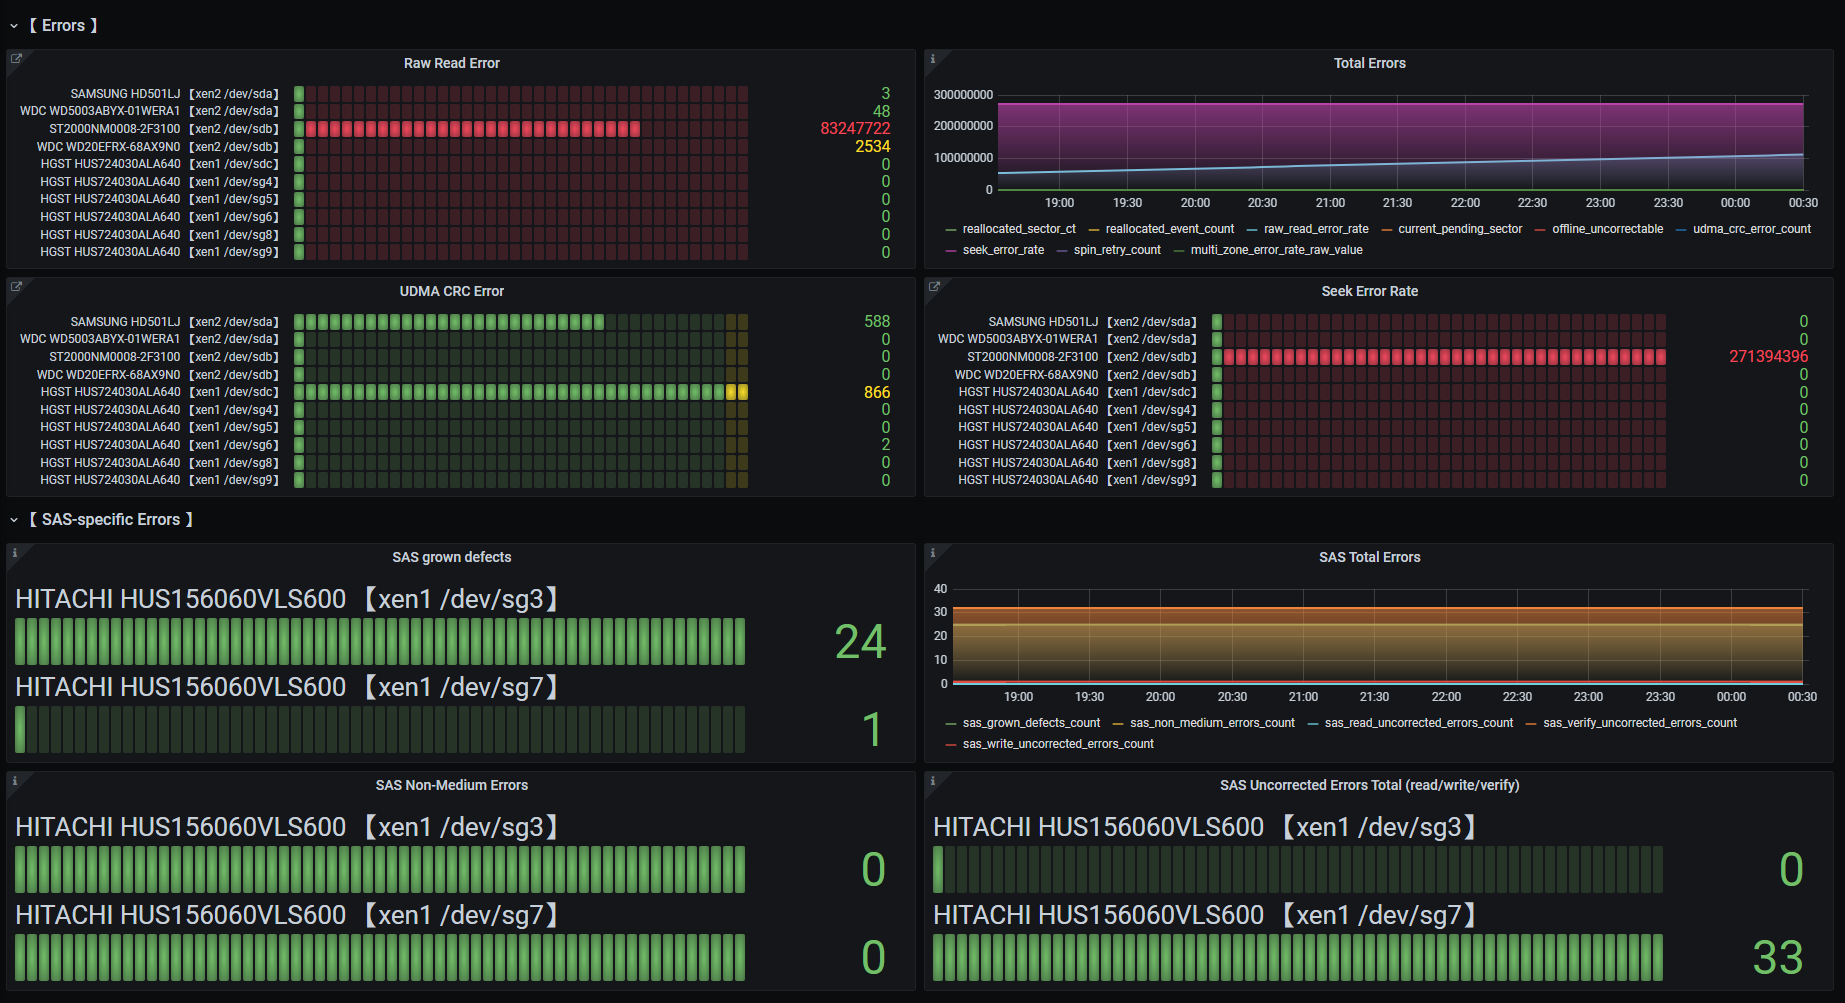
Dashboard for viewing detailed disk information based on S.M.A.R.T data
Screenshots
Used Metrics 2929
:
dev
disk
instance
smartmon_current_pending_sector_raw_value
smartmon_device_active
smartmon_device_info
smartmon_device_smart_healthy
smartmon_load_cycle_count_raw_value
smartmon_multi_zone_error_rate_raw_value
smartmon_offline_uncorrectable_raw_value
smartmon_power_cycle_count_raw_value
smartmon_power_off_retract_count_raw_value
smartmon_power_on_hours_raw_value
smartmon_raw_read_error_rate_raw_value
smartmon_reallocate_nand_blk_cnt_raw_value
smartmon_reallocated_event_count_raw_value
smartmon_reallocated_sector_ct_raw_value
smartmon_sas_grown_defects_count_raw_value
smartmon_sas_non_medium_errors_count_raw_value
smartmon_sas_read_uncorrected_errors_count_raw_value
smartmon_sas_verify_uncorrected_errors_count_raw_value
smartmon_sas_write_uncorrected_errors_count_raw_value
smartmon_seek_error_rate_raw_value
smartmon_spin_retry_count_raw_value
smartmon_spin_up_time_raw_value
smartmon_start_stop_count_raw_value
smartmon_temperature_celsius_raw_value
smartmon_udma_crc_error_count_raw_value