RQ Dashboard 158,291158,291
4/27/2020
12/29/2020
4
>=6.7.3
Prometheus
Description
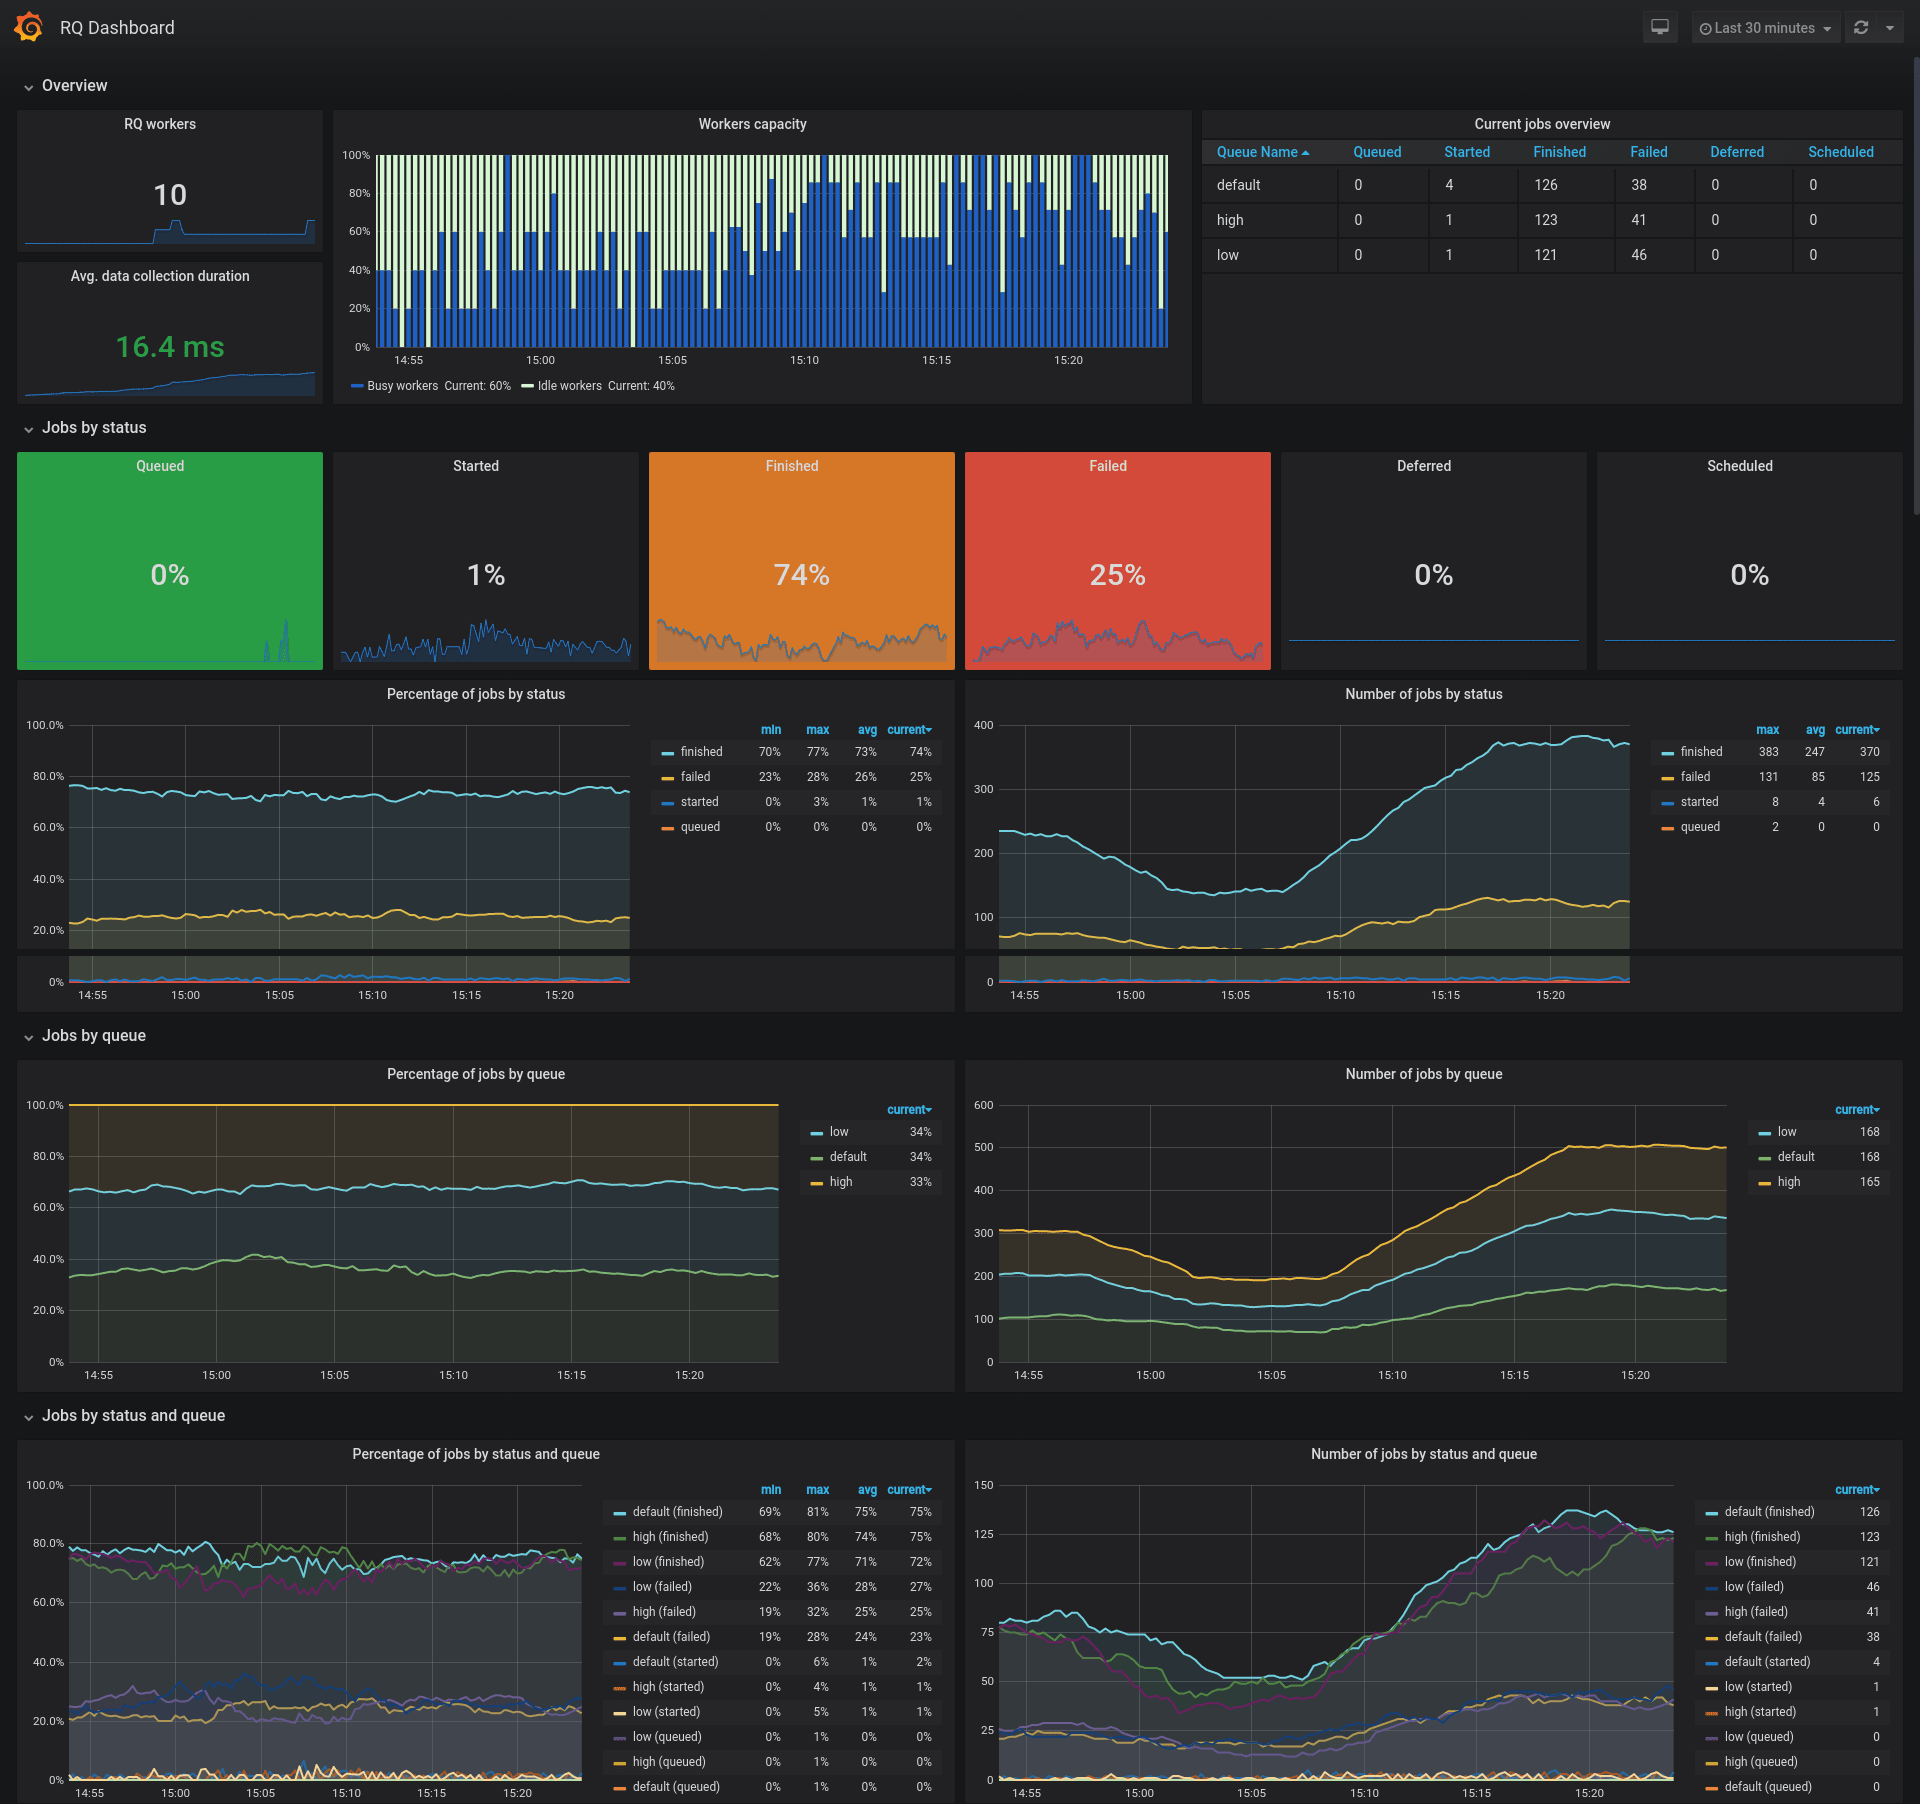
This dashboard monitors the health and throughput of a Redis/RQ-based job queue system, providing real-time visibility into worker availability and job lifecycle. It highlights key metrics such as rq_workers for capacity, rq_jobs for overall queue state, and the per-status and per-queue distributions to diagnose bottlenecks. It combines summary gauges (e.g., Current jobs overview, Queued, Started, Finished, Failed, Deferred, Scheduled) with distribution charts (Percentage of jobs by status/queue) to give a concise operational view.
Screenshots
Used Metrics 44
rq_jobs
rq_request_processing_seconds_count
rq_request_processing_seconds_sum
rq_workers
Get Dashboard✕
Download
Copy to Clipboard