Routinator 1,1921,192 3.0 (2 reviews)
3/17/2020
4/22/2024
7
Host Metrics
>=10.4.1
Prometheus
Description
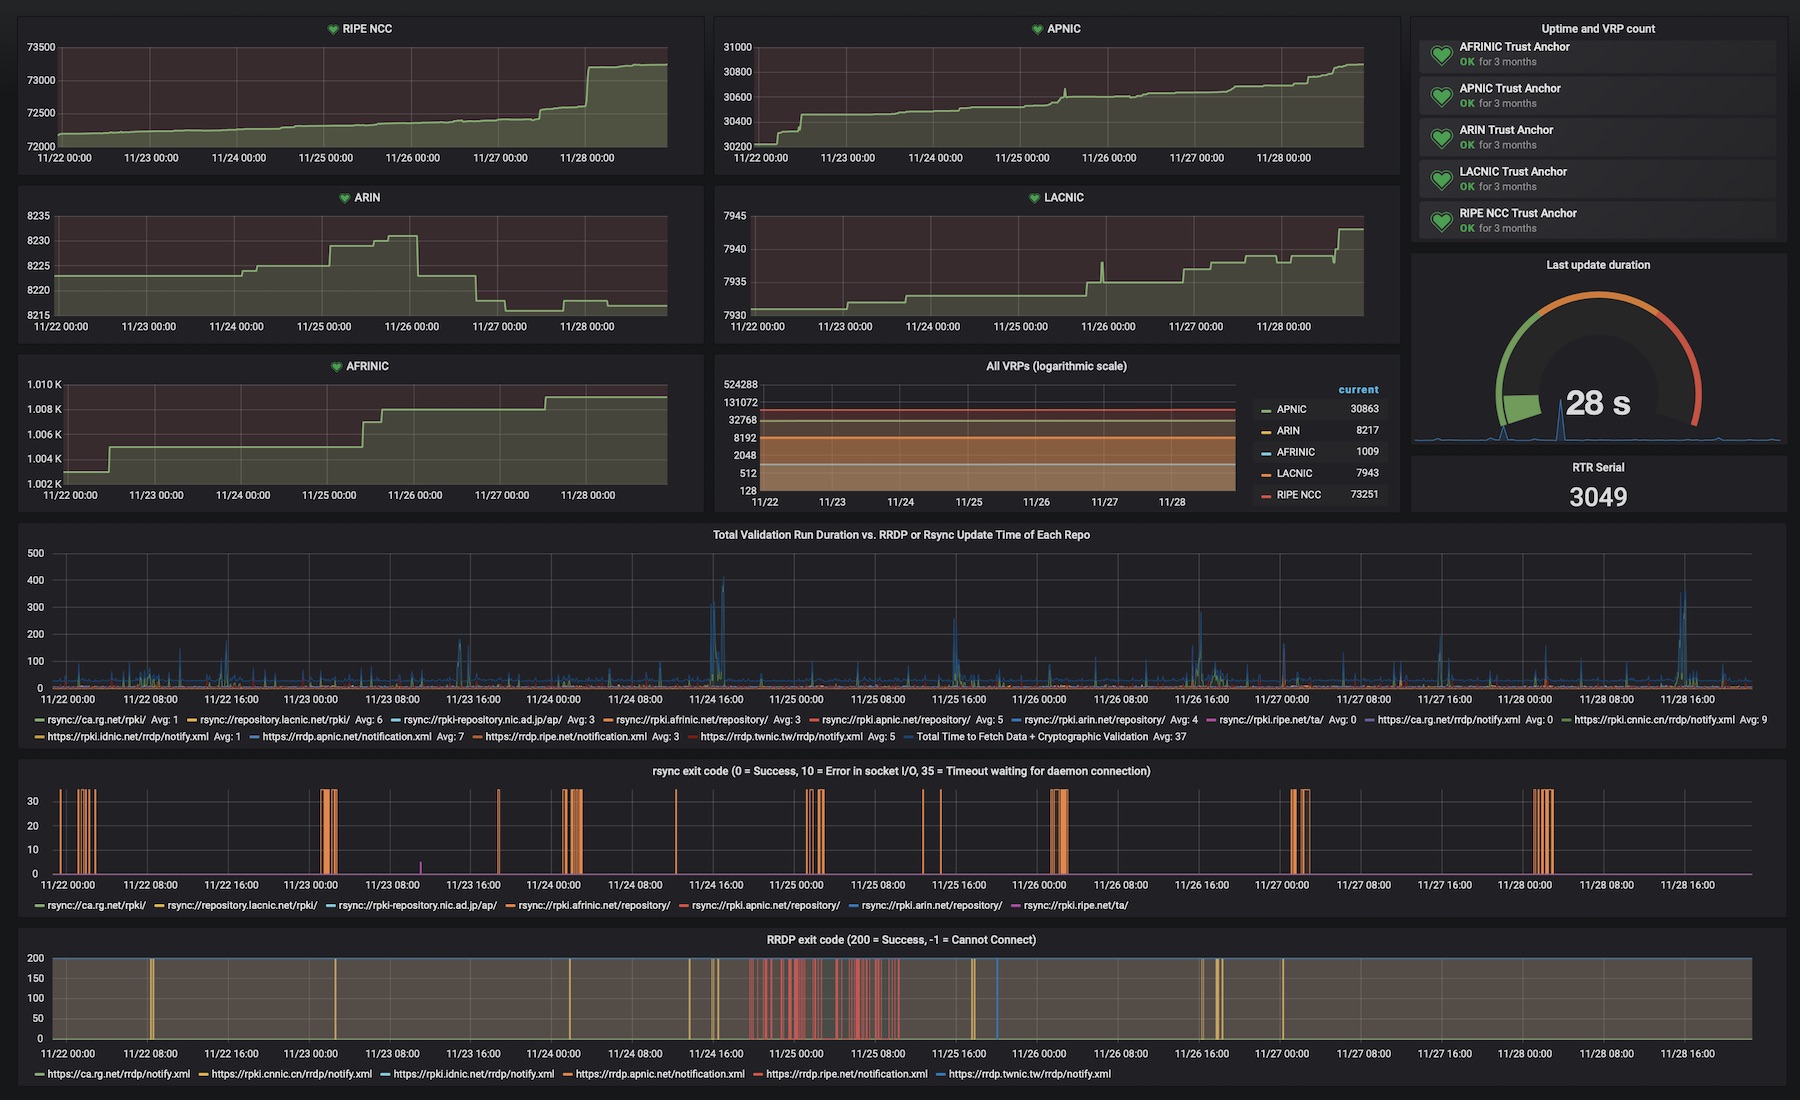
This dashboard provides trust anchor and repository statistics
Screenshots
Used Metrics 1313
routinator_last_update_duration
routinator_repository_contributed_vrps_total
routinator_repository_duplicate_vrps_total
routinator_repository_locally_filtered_vrps_total
routinator_repository_objects_total
routinator_repository_publication_points_total
routinator_repository_unsafe_vrps_total
routinator_rrdp_duration
routinator_rrdp_status
routinator_rsync_duration
routinator_rsync_status
routinator_serial
routinator_ta_valid_vrps_total
Get Dashboard✕
Download
Copy to Clipboard