Rocket.Chat MicroService Metrics 805805
5/13/2025
8/6/2025
1
>=11.6.1
Prometheus
Description
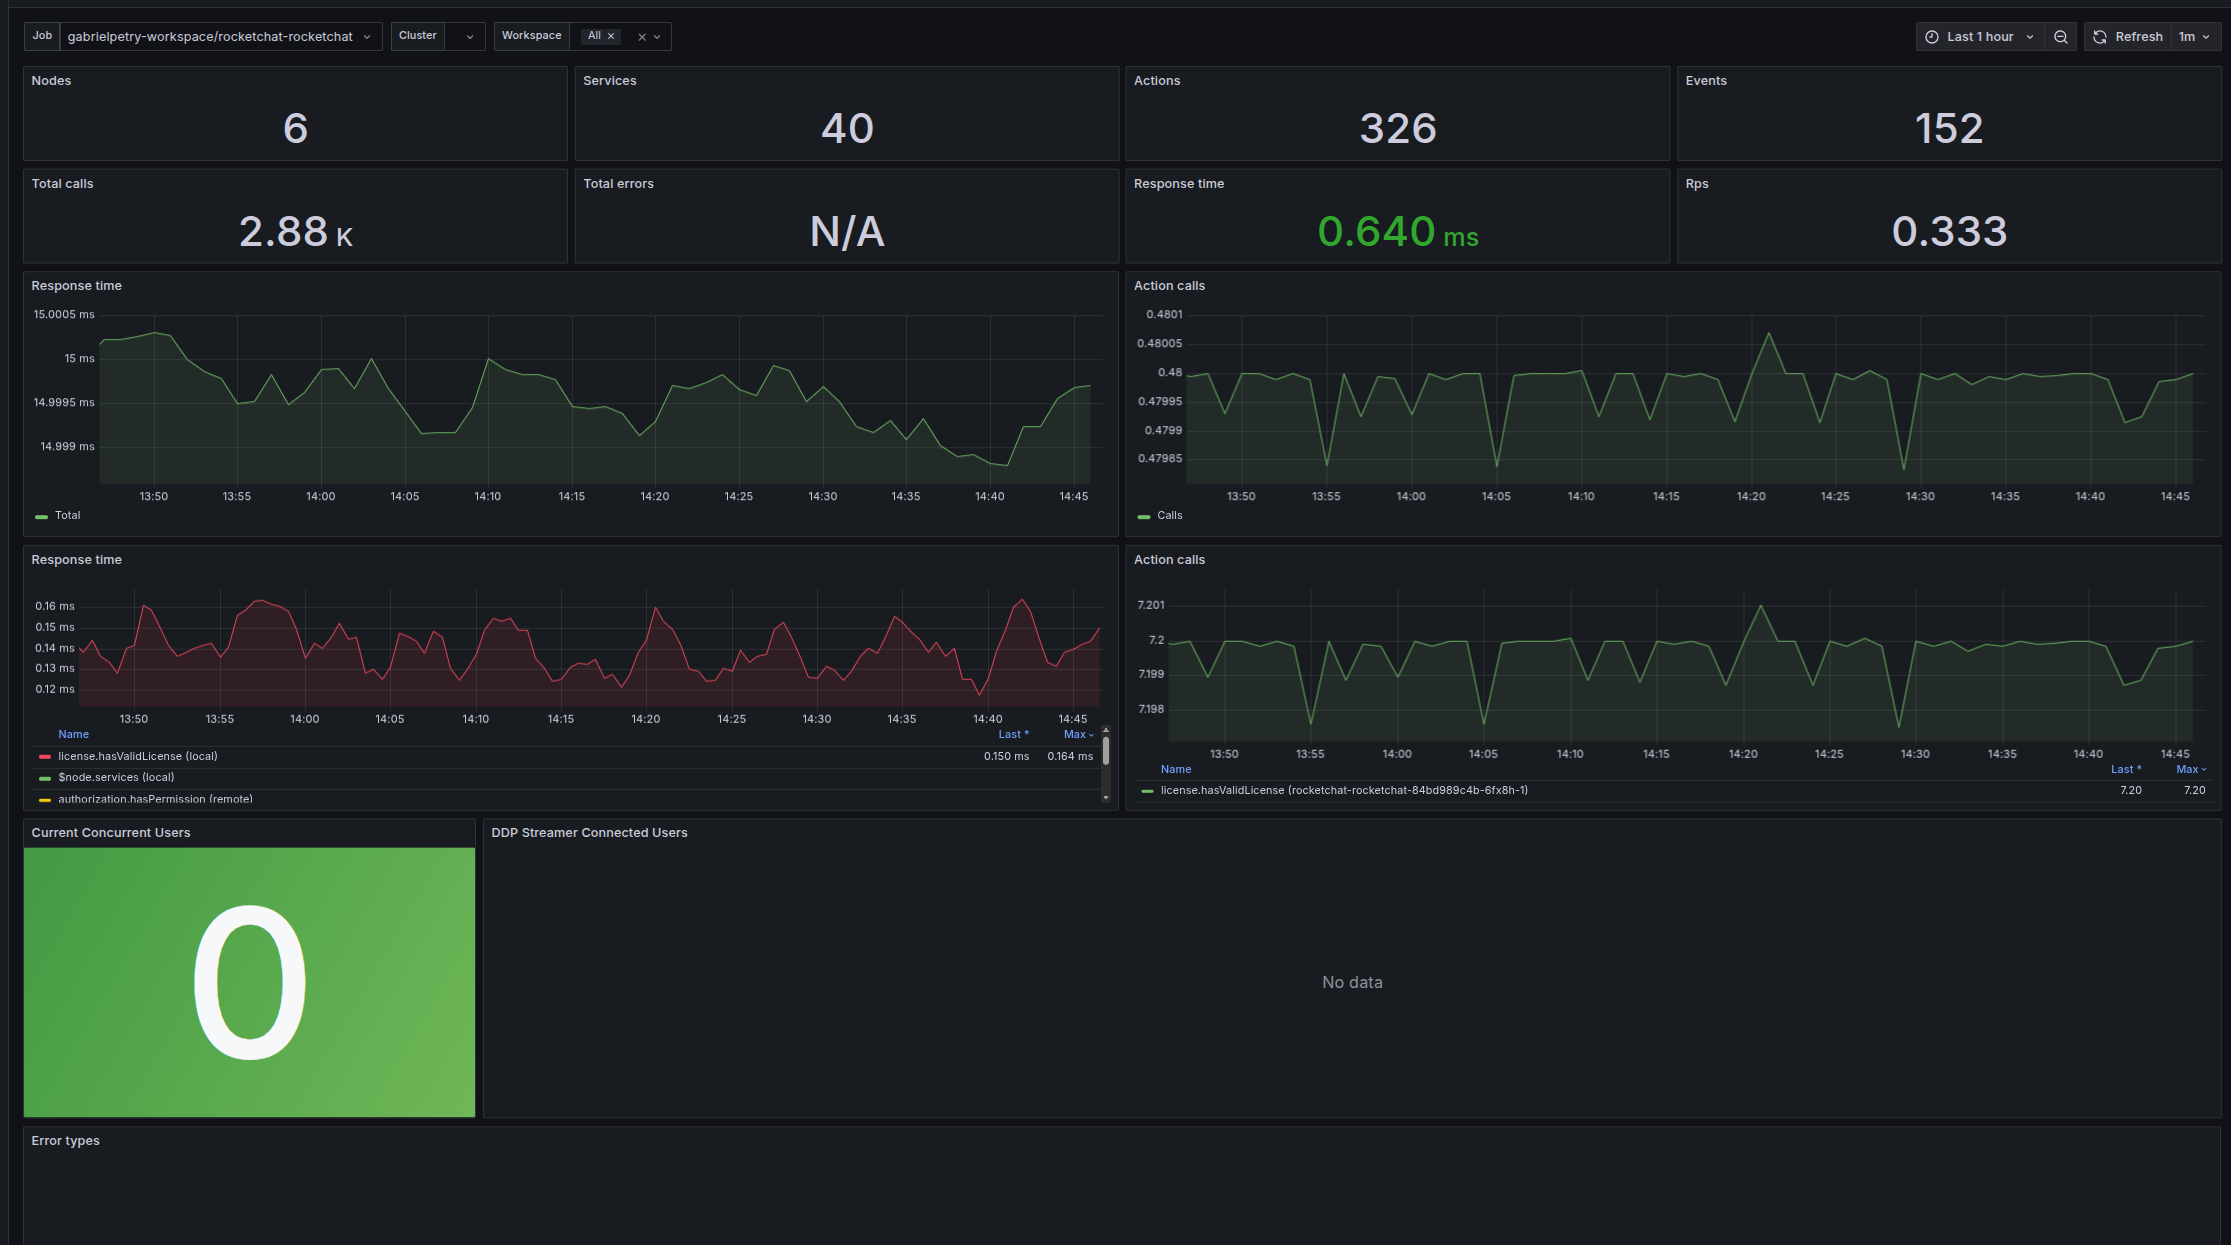
A specialized dashboard for monitoring Rocket.Chat deployments using the microservices architecture. This dashboard provides detailed metrics on each microservice component, allowing for granular monitoring and troubleshooting of the distributed Rocket.Chat deployments.
Screenshots
Used Metrics 1616
moleculer_event_broadcast_local_total
moleculer_registry_actions_total
moleculer_registry_events_total
moleculer_registry_nodes_online_total
moleculer_registry_nodes_total
moleculer_registry_services_total
moleculer_request_error_total
moleculer_request_error_total_rate
moleculer_request_time_count
moleculer_request_time_rate
moleculer_request_time_sum
moleculer_request_total
moleculer_request_total_rate
quantile
rocketchat_users_online
users_connected
Get Dashboard✕
Download
Copy to Clipboard