Restic Exporter 10,147,00310,147,003 5.0 (1 reviews)
12/6/2022
10/14/2023
2
>=9.3.0
Prometheus
Description
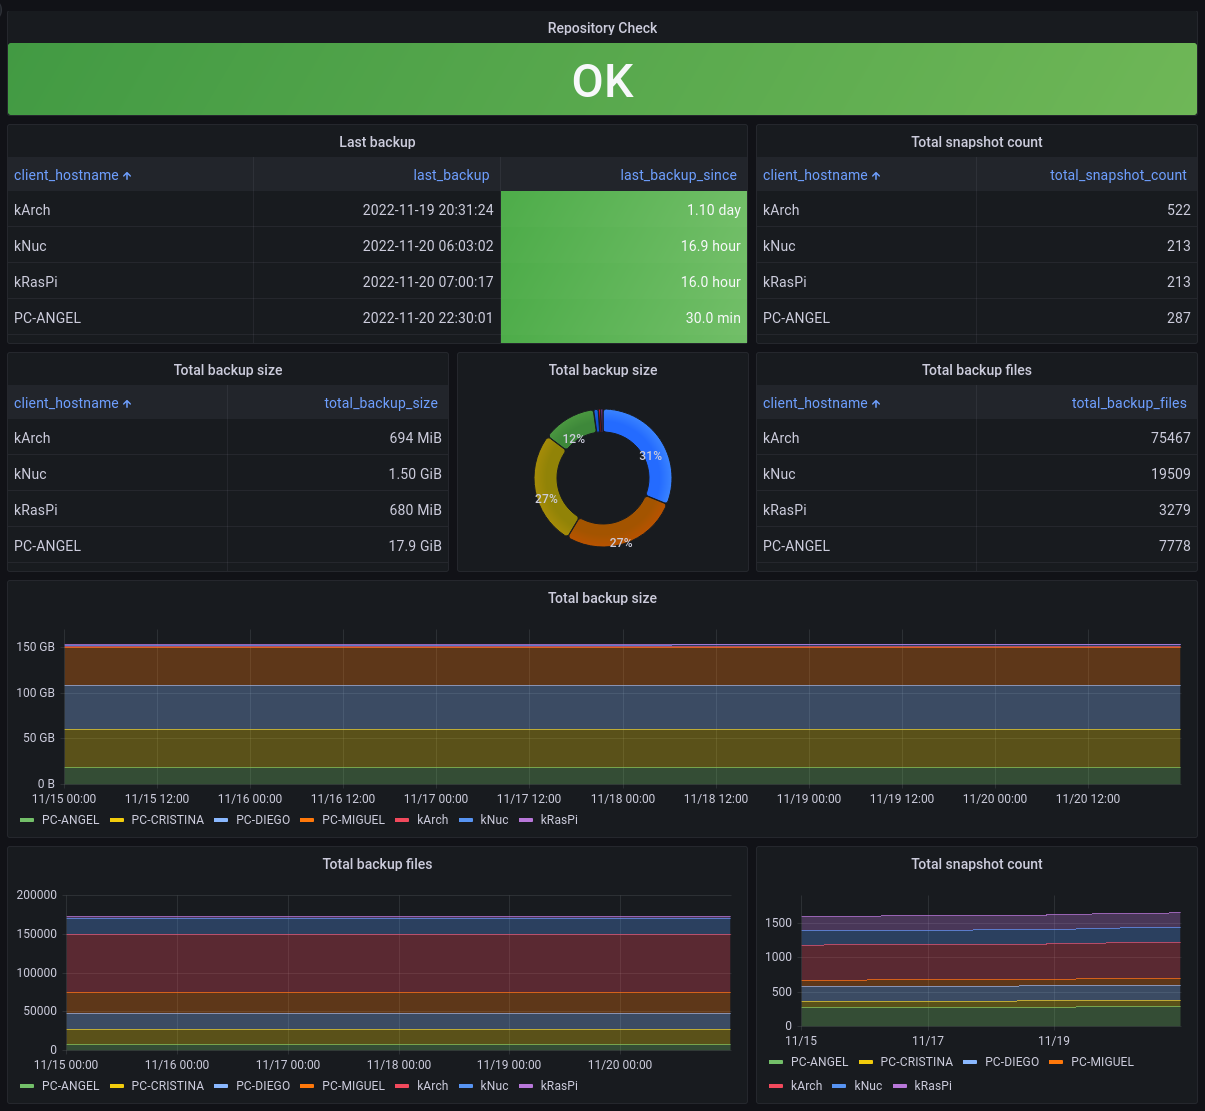
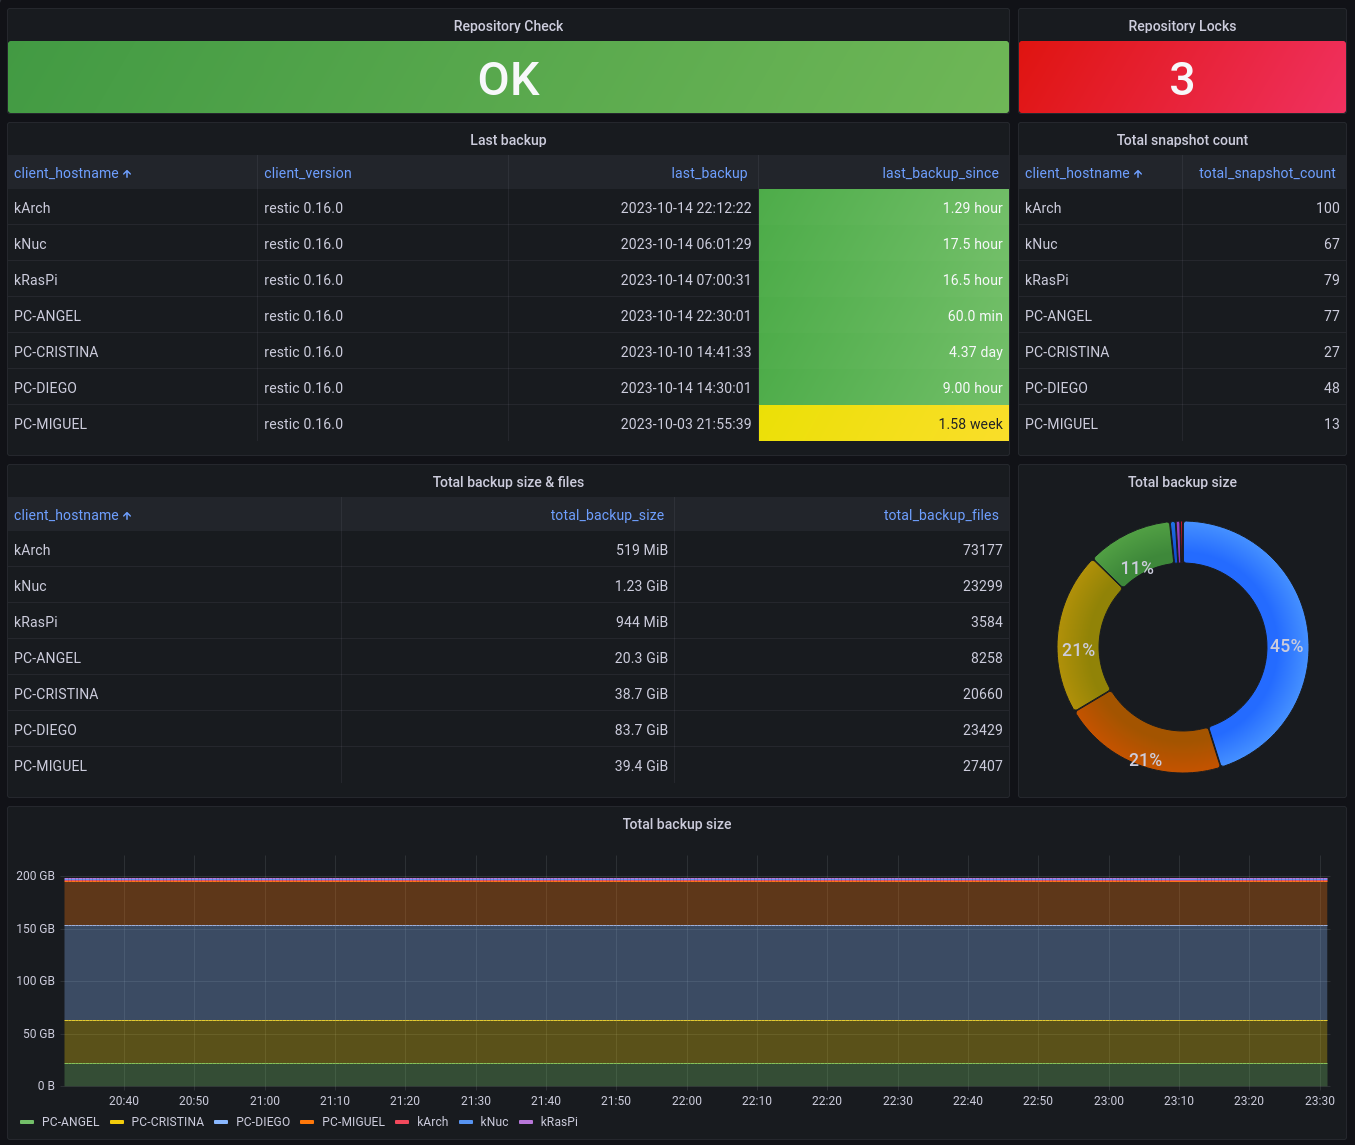
This dashboard monitors the health and activity of a Restic backup system by visualizing core metrics such as restic_check_success (verification status), restic_locks_total (concurrency/lock state), and restic_backup_timestamp (recency of backups). It highlights total backup metrics like restic_backup_snapshots_total, restic_backup_size_total, and restic_backup_files_total to track backup volume, size, and file count over time, with panels for repository checks, locks, recency, and cumulative totals to quickly assess backup integrity and capacity trends.
Screenshots
Used Metrics 66
restic_backup_files_total
restic_backup_size_total
restic_backup_snapshots_total
restic_backup_timestamp
restic_check_success
restic_locks_total
Get Dashboard✕
Download
Copy to Clipboard