Request Handling Performance 153,144153,144
Description
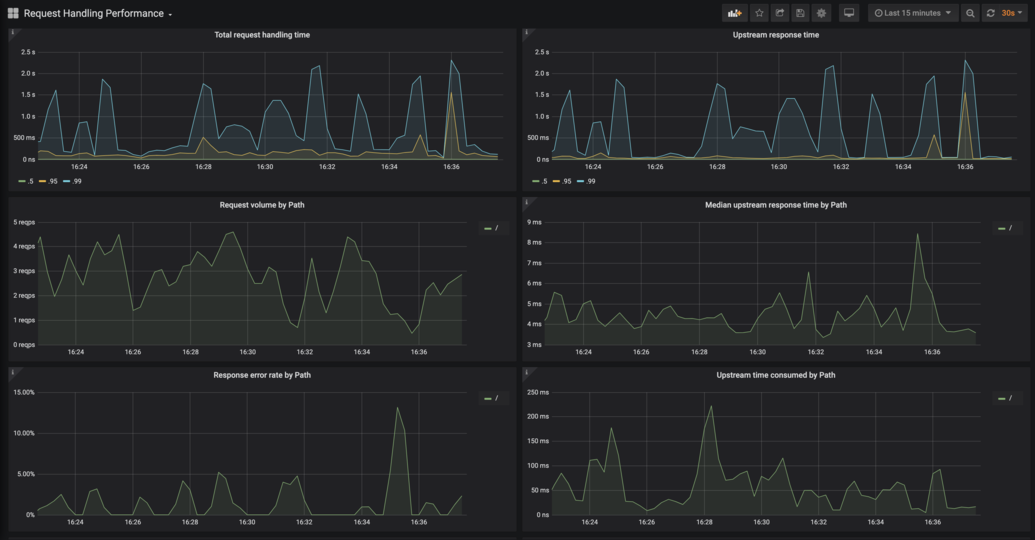
This dashboard monitors HTTP request handling performance for an nginx ingress setup, with a focus on latency, throughput, and upstream interactions. It highlights latency distributions via nginx_ingress_controller_request_duration_seconds_bucket and ...duration_seconds_count plus ...duration_seconds_sum, and tracks upstream latency with nginx_ingress_controller_ingress_upstream_latency_seconds_sum/count to reveal where bottlenecks occur. Key panels show request volume by Path, median upstream response time by Path, and response error rate by Path, enabling quick identification of slow paths, high-error routes, and size/throughput characteristics using ...response_size_* and ...response_size_bucket metrics.
Screenshots
Used Metrics 99
nginx_ingress_controller_ingress_upstream_latency_seconds_count
nginx_ingress_controller_ingress_upstream_latency_seconds_sum
nginx_ingress_controller_request_duration_seconds_bucket
nginx_ingress_controller_request_duration_seconds_count
nginx_ingress_controller_response_duration_seconds_bucket
nginx_ingress_controller_response_duration_seconds_sum
nginx_ingress_controller_response_size_bucket
nginx_ingress_controller_response_size_count
nginx_ingress_controller_response_size_sum