Redpanda Ops Dashboard 7,2107,210
2/18/2023
10/24/2024
3
Host Metrics
>=9.3.6
Prometheus
Description
Screenshots
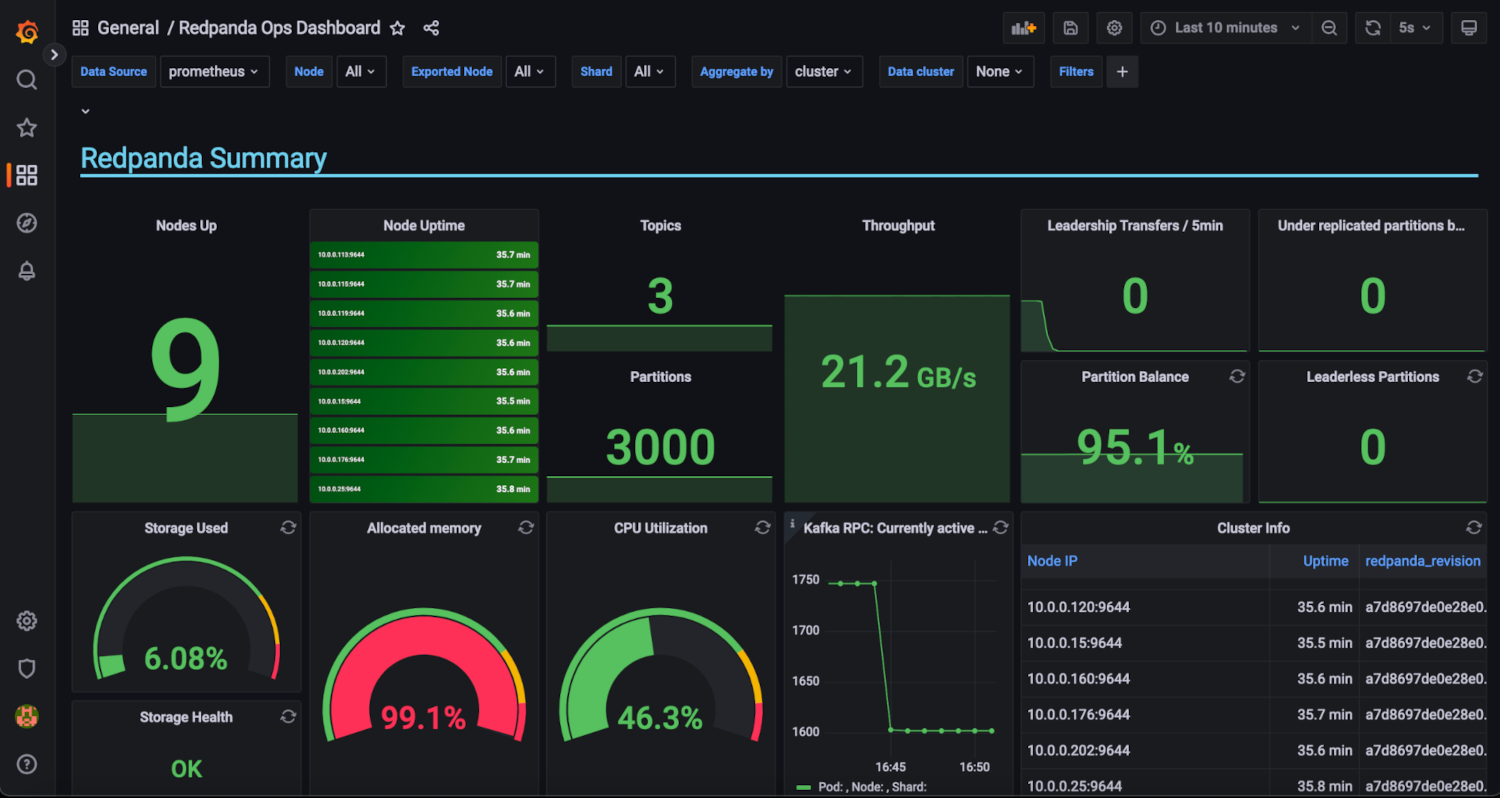
Used Metrics 2323
:
redpanda_application_build
redpanda_application_uptime_seconds_total
redpanda_cluster_topics
redpanda_cluster_unavailable_partitions
redpanda_cpu_busy_seconds_total
redpanda_io_queue_total_read_ops
redpanda_io_queue_total_write_ops
redpanda_kafka_handler_latency_seconds_bucket
redpanda_kafka_max_offset
redpanda_kafka_partitions
redpanda_kafka_request_bytes_total
redpanda_kafka_under_replicated_replicas
redpanda_memory_available_memory
redpanda_memory_available_memory_low_water_mark
redpanda_raft_leadership_changes
redpanda_rpc_active_connections
redpanda_rpc_request_latency_seconds_bucket
redpanda_storage_disk_free_bytes
redpanda_storage_disk_free_space_alert
redpanda_storage_disk_total_bytes
stddev
topk
Get Dashboard✕
Download
Copy to Clipboard