Redpanda Kafka Topic Metrics 1,8051,805
2/17/2023
11/14/2024
2
Host Metrics
>=9.3.6
Prometheus
Description
Redpanda Kafka Topic Metrics
Screenshots
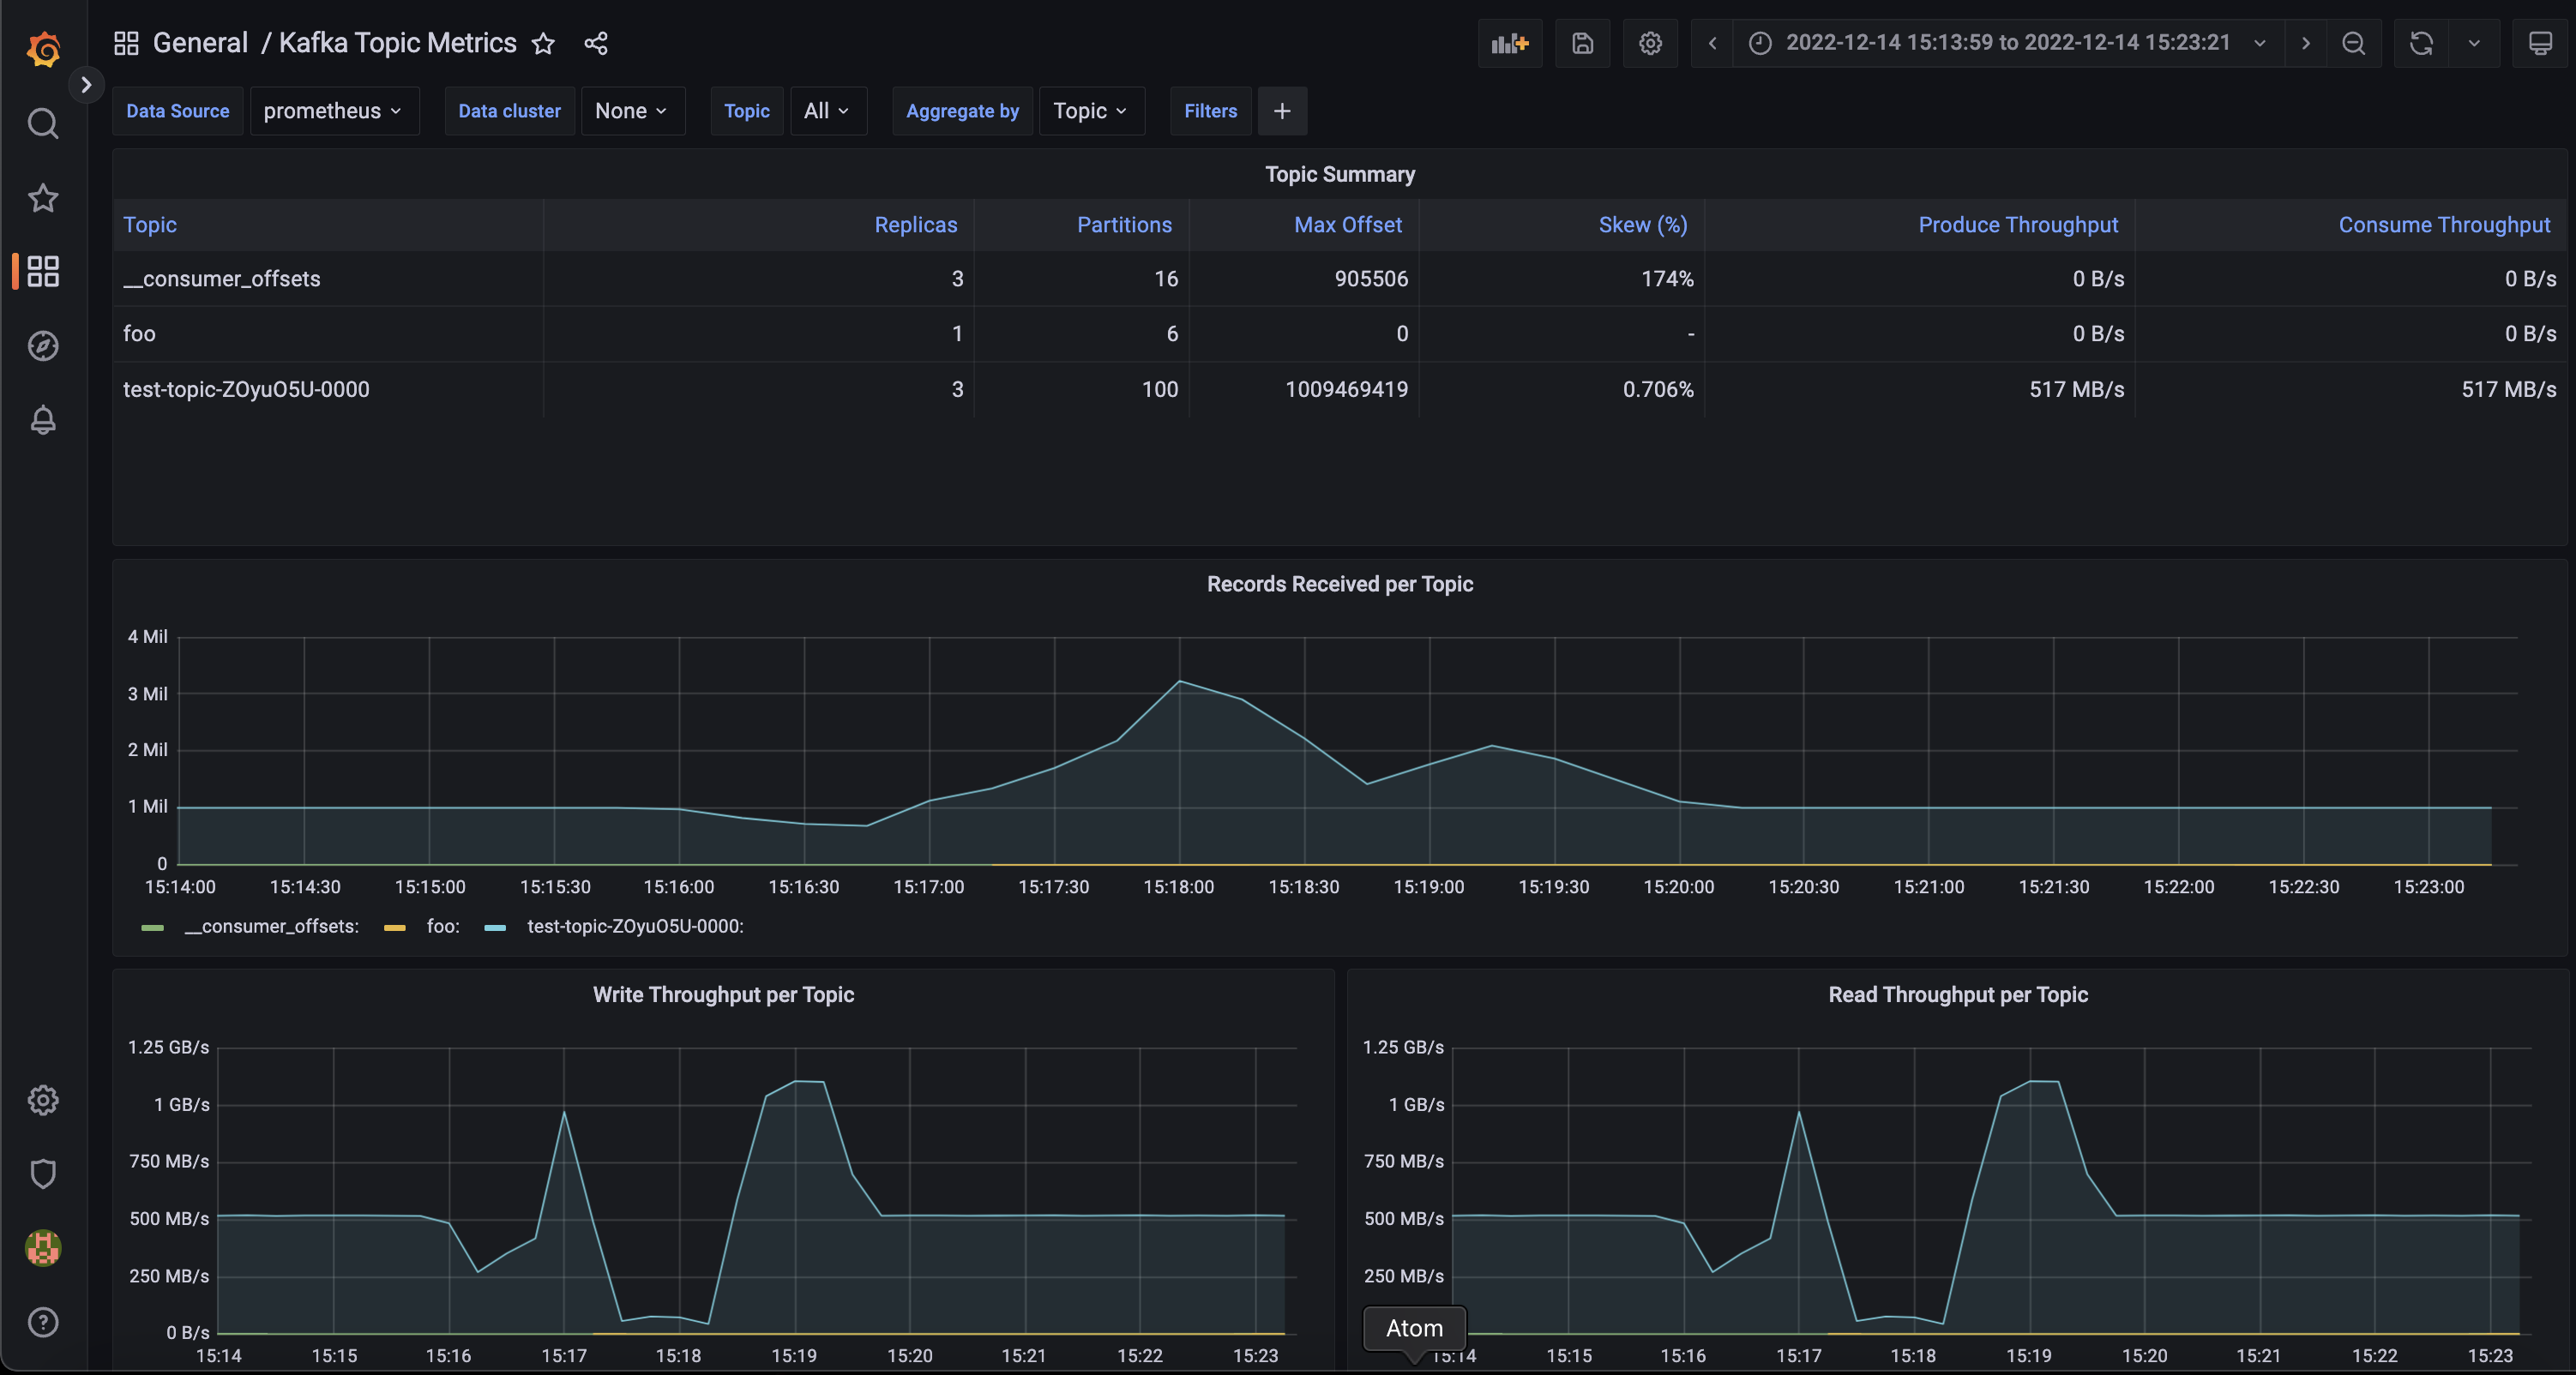
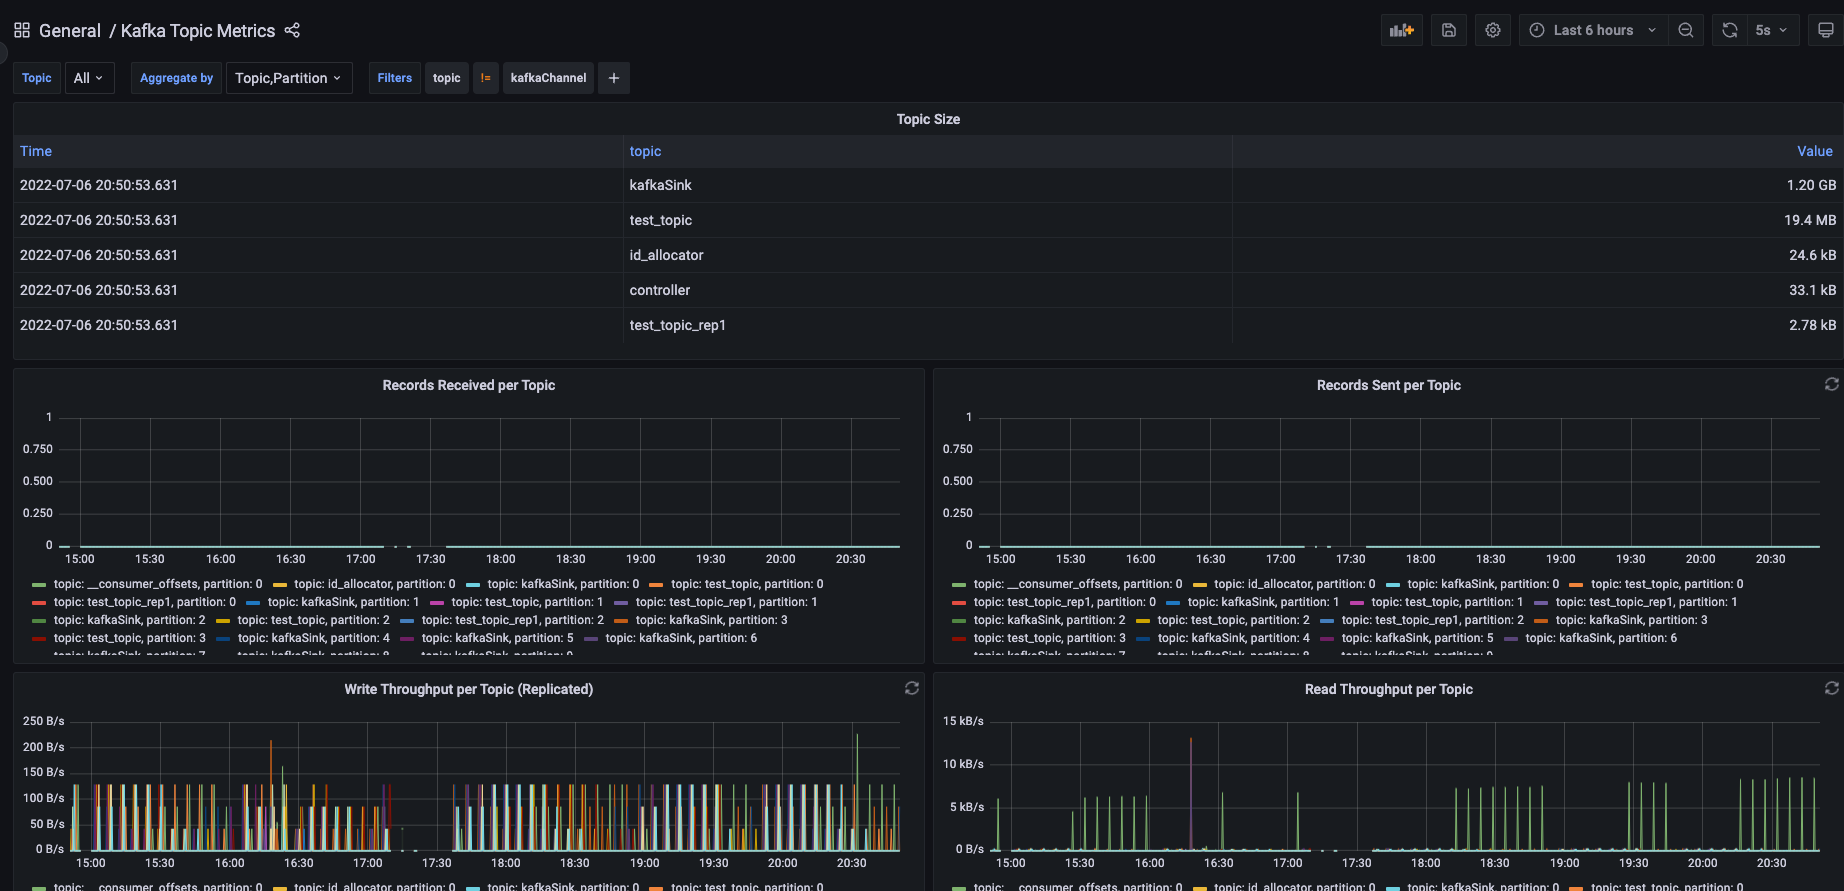
Used Metrics 55
redpanda_kafka_max_offset
redpanda_kafka_partitions
redpanda_kafka_replicas
redpanda_kafka_request_bytes_total
stddev
Get Dashboard✕
Download
Copy to Clipboard