Redis Enterprise: Cluster Status 1,9491,949
3/31/2023
4/15/2023
1
>=9.3.6
Prometheus
Description
Prometheus-based dashboard for monitoring your Redis Enterprise Software databases.
Screenshots
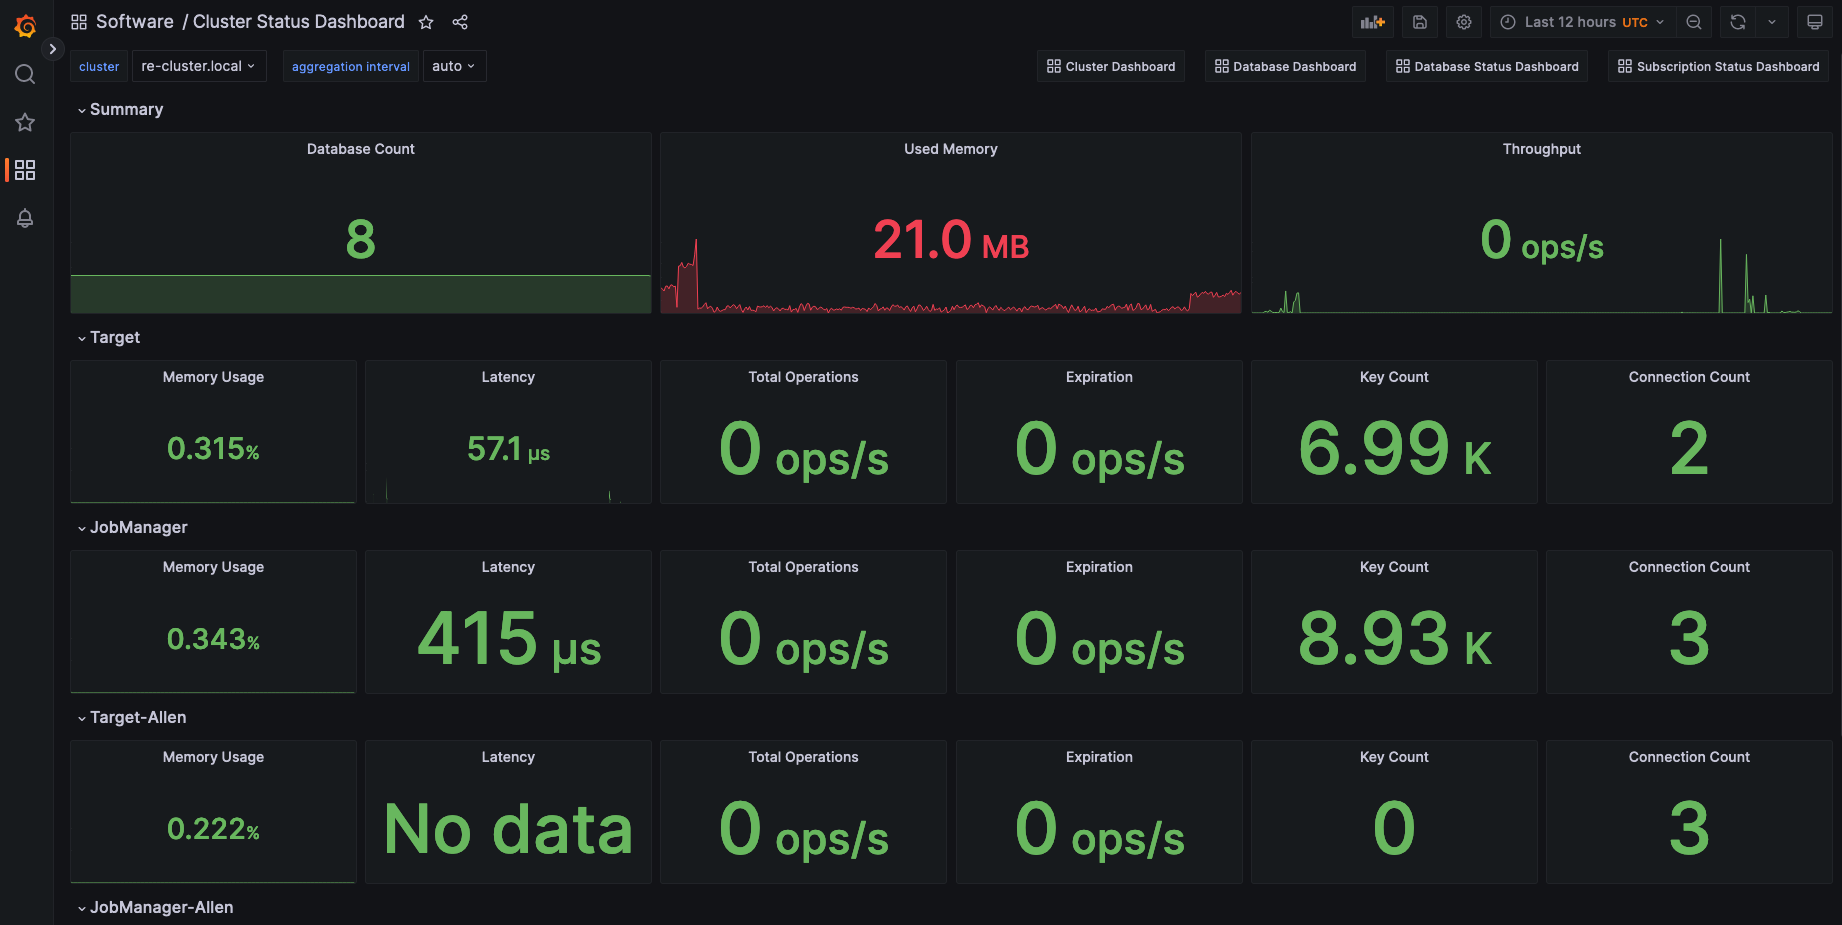
Used Metrics 88
bdb_avg_latency
bdb_conns
bdb_expired_objects
bdb_memory_limit
bdb_no_of_keys
bdb_total_req
bdb_up
bdb_used_memory
Get Dashboard✕
Download
Copy to Clipboard