Rails Metrics 7,7497,749
6/6/2019
2/16/2024
3
>=10.2.3
Description
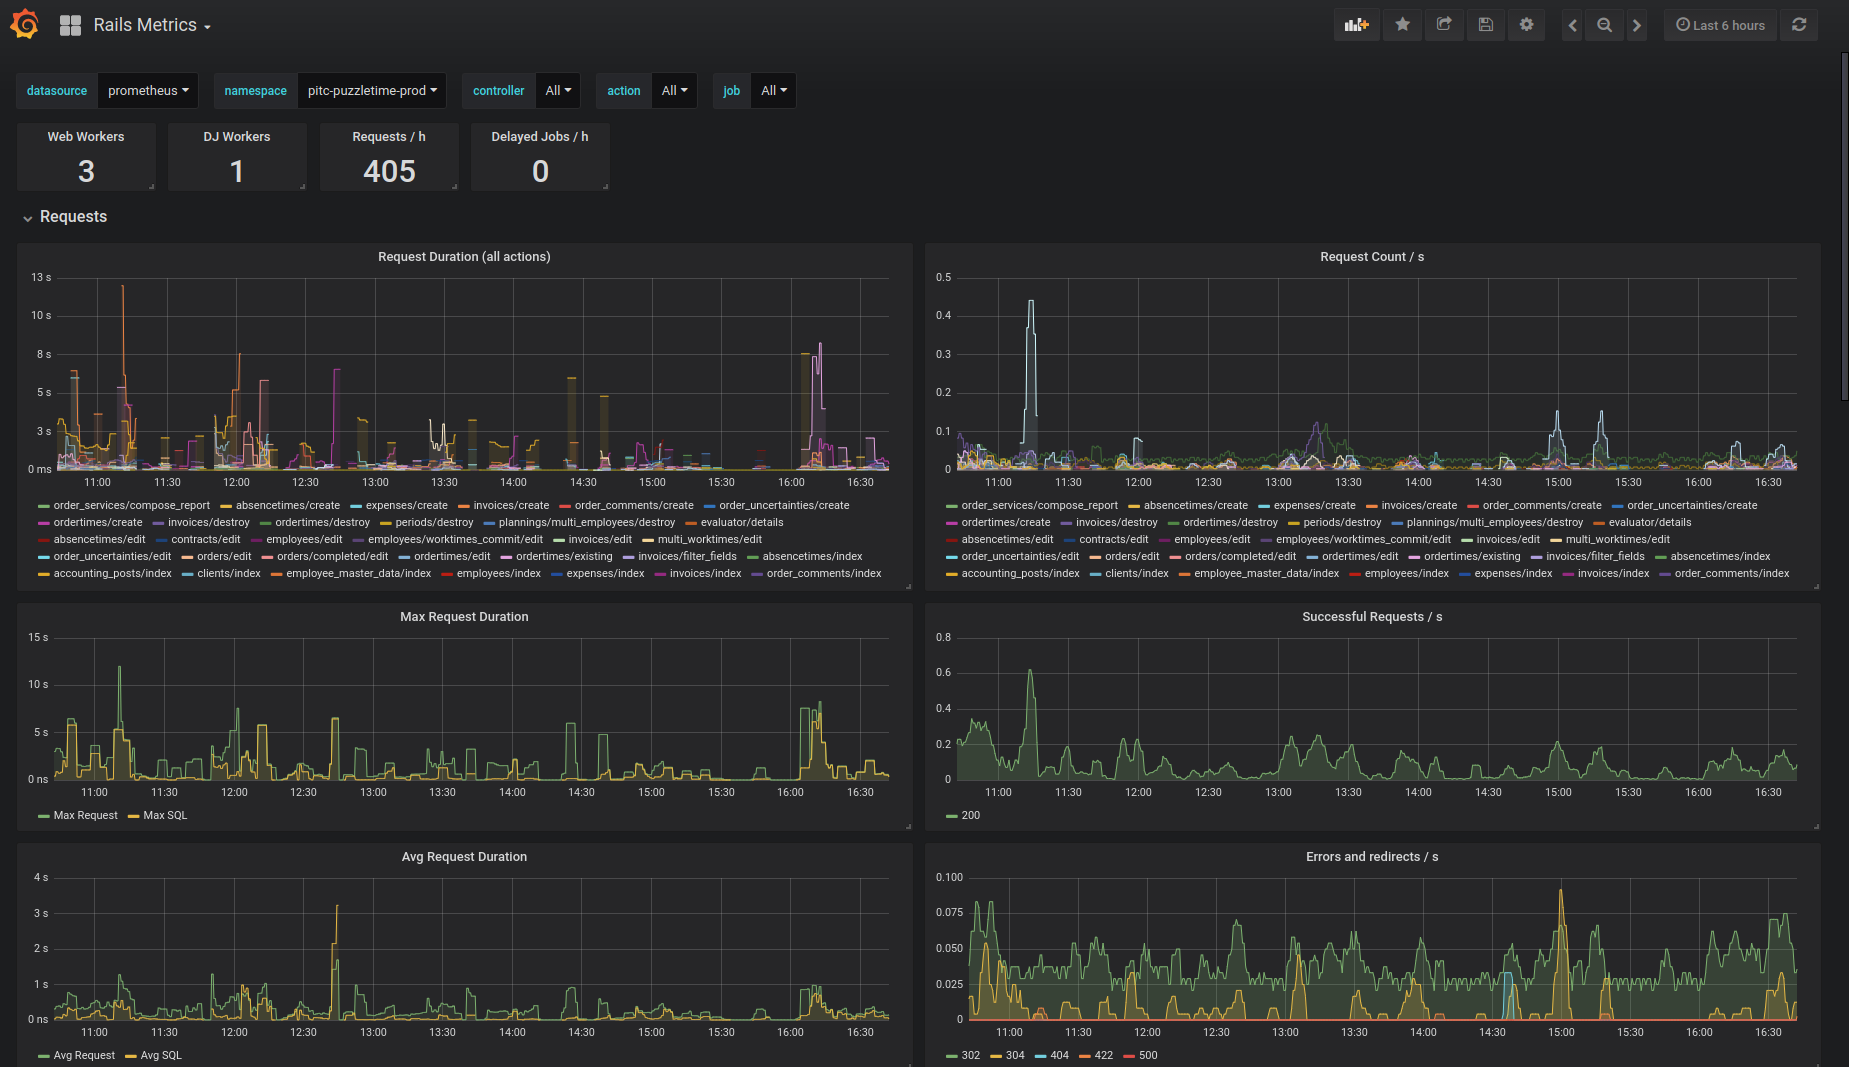
Screenshots
Used Metrics 1919
quantile
ruby_allocated_objects_total
ruby_delayed_job_duration_seconds
ruby_delayed_job_duration_seconds_summary_count
ruby_delayed_job_duration_seconds_summary_sum
ruby_delayed_jobs_enqueued
ruby_delayed_jobs_pending
ruby_delayed_jobs_total
ruby_heap_free_slots
ruby_heap_live_slots
ruby_http_request_duration_seconds_count
ruby_http_request_duration_seconds_sum
ruby_http_request_sql_duration_seconds_count
ruby_http_request_sql_duration_seconds_sum
ruby_http_requests_total
ruby_puma_request_backlog
ruby_puma_thread_pool_capacity
ruby_rss
topk
Get Dashboard✕
Download
Copy to Clipboard