RabbitMQ Queues Overview - Seventh State RabbitMQ Support 5,5185,518
3/15/2024
12/10/2024
4
RabbitMQ
>=10.4.0
Prometheus
Description
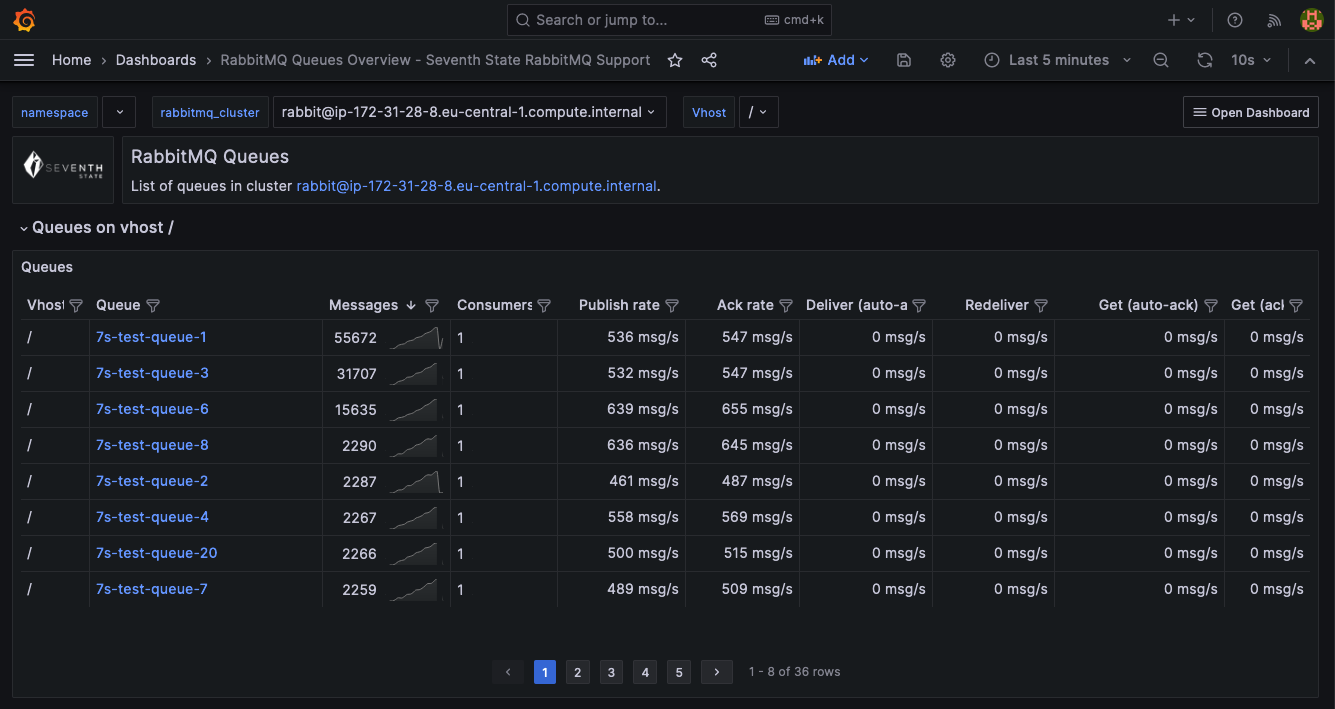
Overview of all queues in a RabbitMQ Cluster
Screenshots
Used Metrics 1313
queue_vhost
rabbitmq_cluster
rabbitmq_detailed_channel_get_ack_total
rabbitmq_detailed_channel_get_total
rabbitmq_detailed_channel_messages_acked_total
rabbitmq_detailed_channel_messages_delivered_total
rabbitmq_detailed_channel_messages_redelivered_total
rabbitmq_detailed_queue_consumers
rabbitmq_detailed_queue_messages
rabbitmq_detailed_queue_messages_published_total
rabbitmq_identity_info
rabbitmq_node
vhost
Get Dashboard✕
Download
Copy to Clipboard