RabbitMQ Queue Details - Seventh State RabbitMQ Support 5,0095,009
3/15/2024
11/27/2024
3
RabbitMQ
>=10.4.0
Prometheus
Description
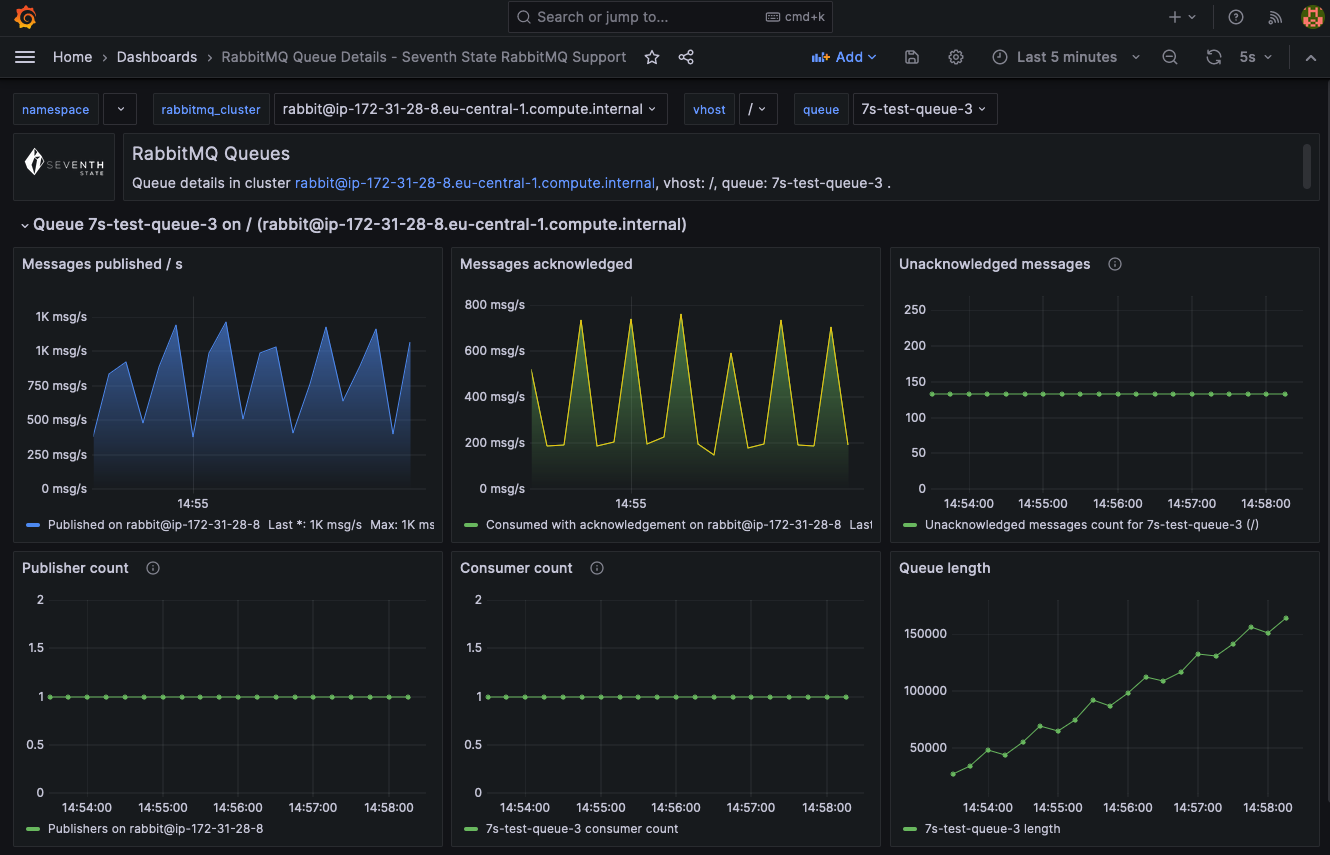
Screenshots
Used Metrics 1414
rabbitmq_cluster
rabbitmq_detailed_channel_get_ack_total
rabbitmq_detailed_channel_get_empty_total
rabbitmq_detailed_channel_get_total
rabbitmq_detailed_channel_messages_acked_total
rabbitmq_detailed_channel_messages_delivered_total
rabbitmq_detailed_queue_consumers
rabbitmq_detailed_queue_messages
rabbitmq_detailed_queue_messages_published_total
rabbitmq_detailed_queue_messages_unacked
rabbitmq_identity_info
rabbitmq_node
rabbitmq_vhost
vhost
Get Dashboard✕
Download
Copy to Clipboard