RabbitMQ-PerfTest 170,526170,526
Description
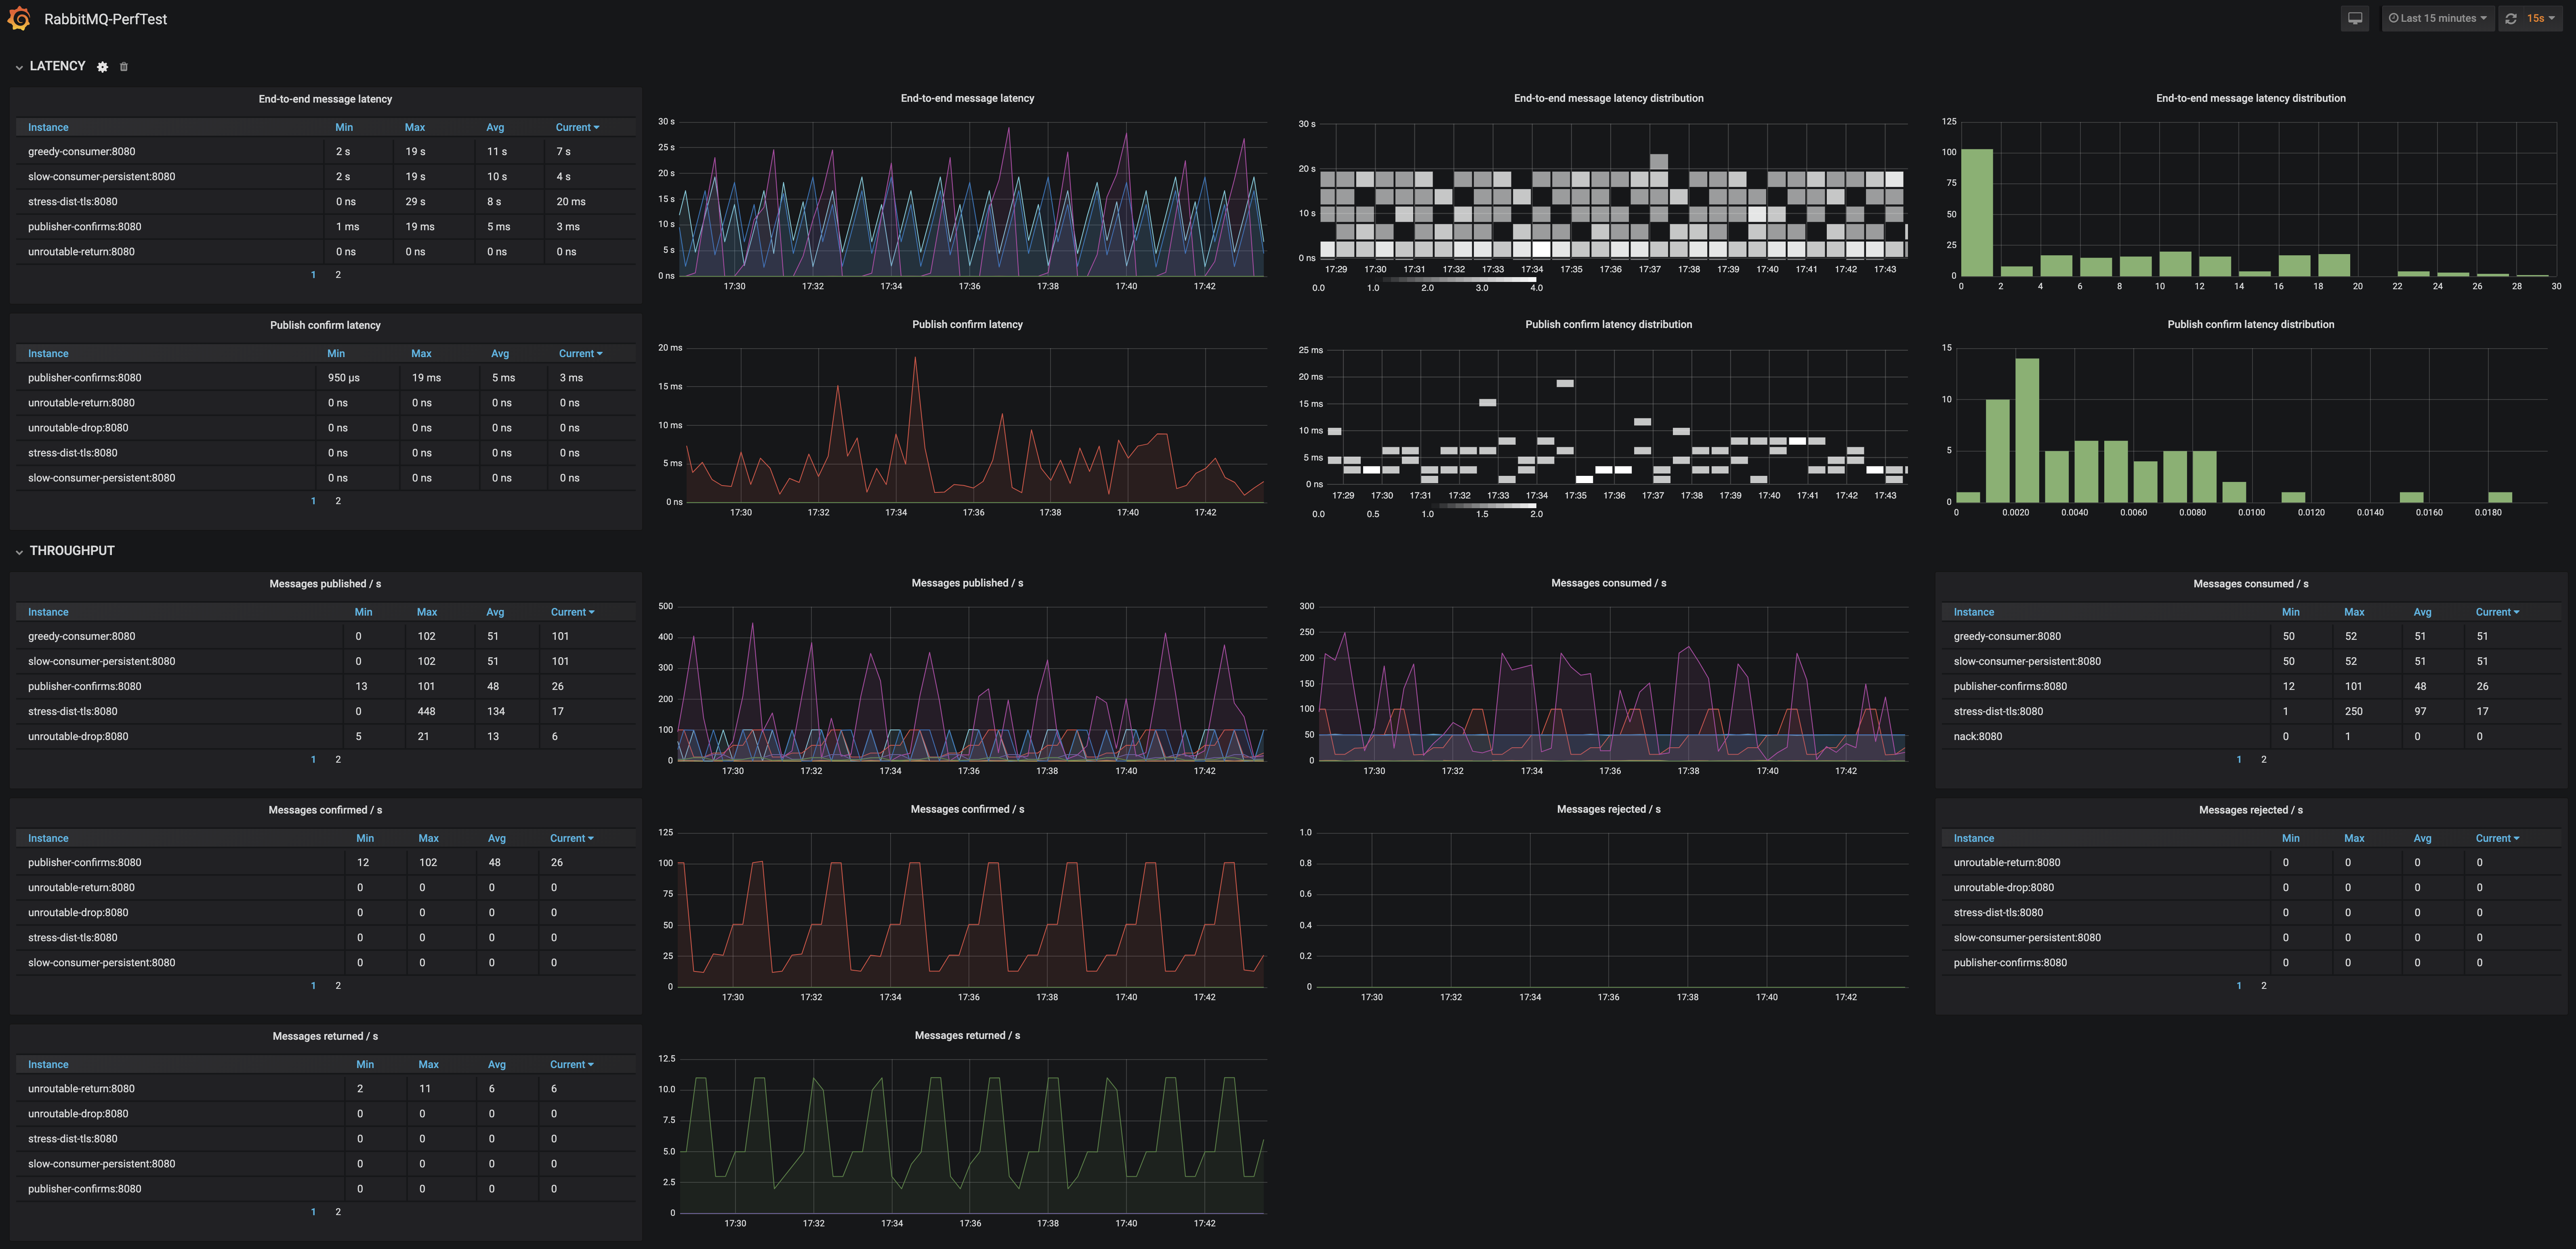
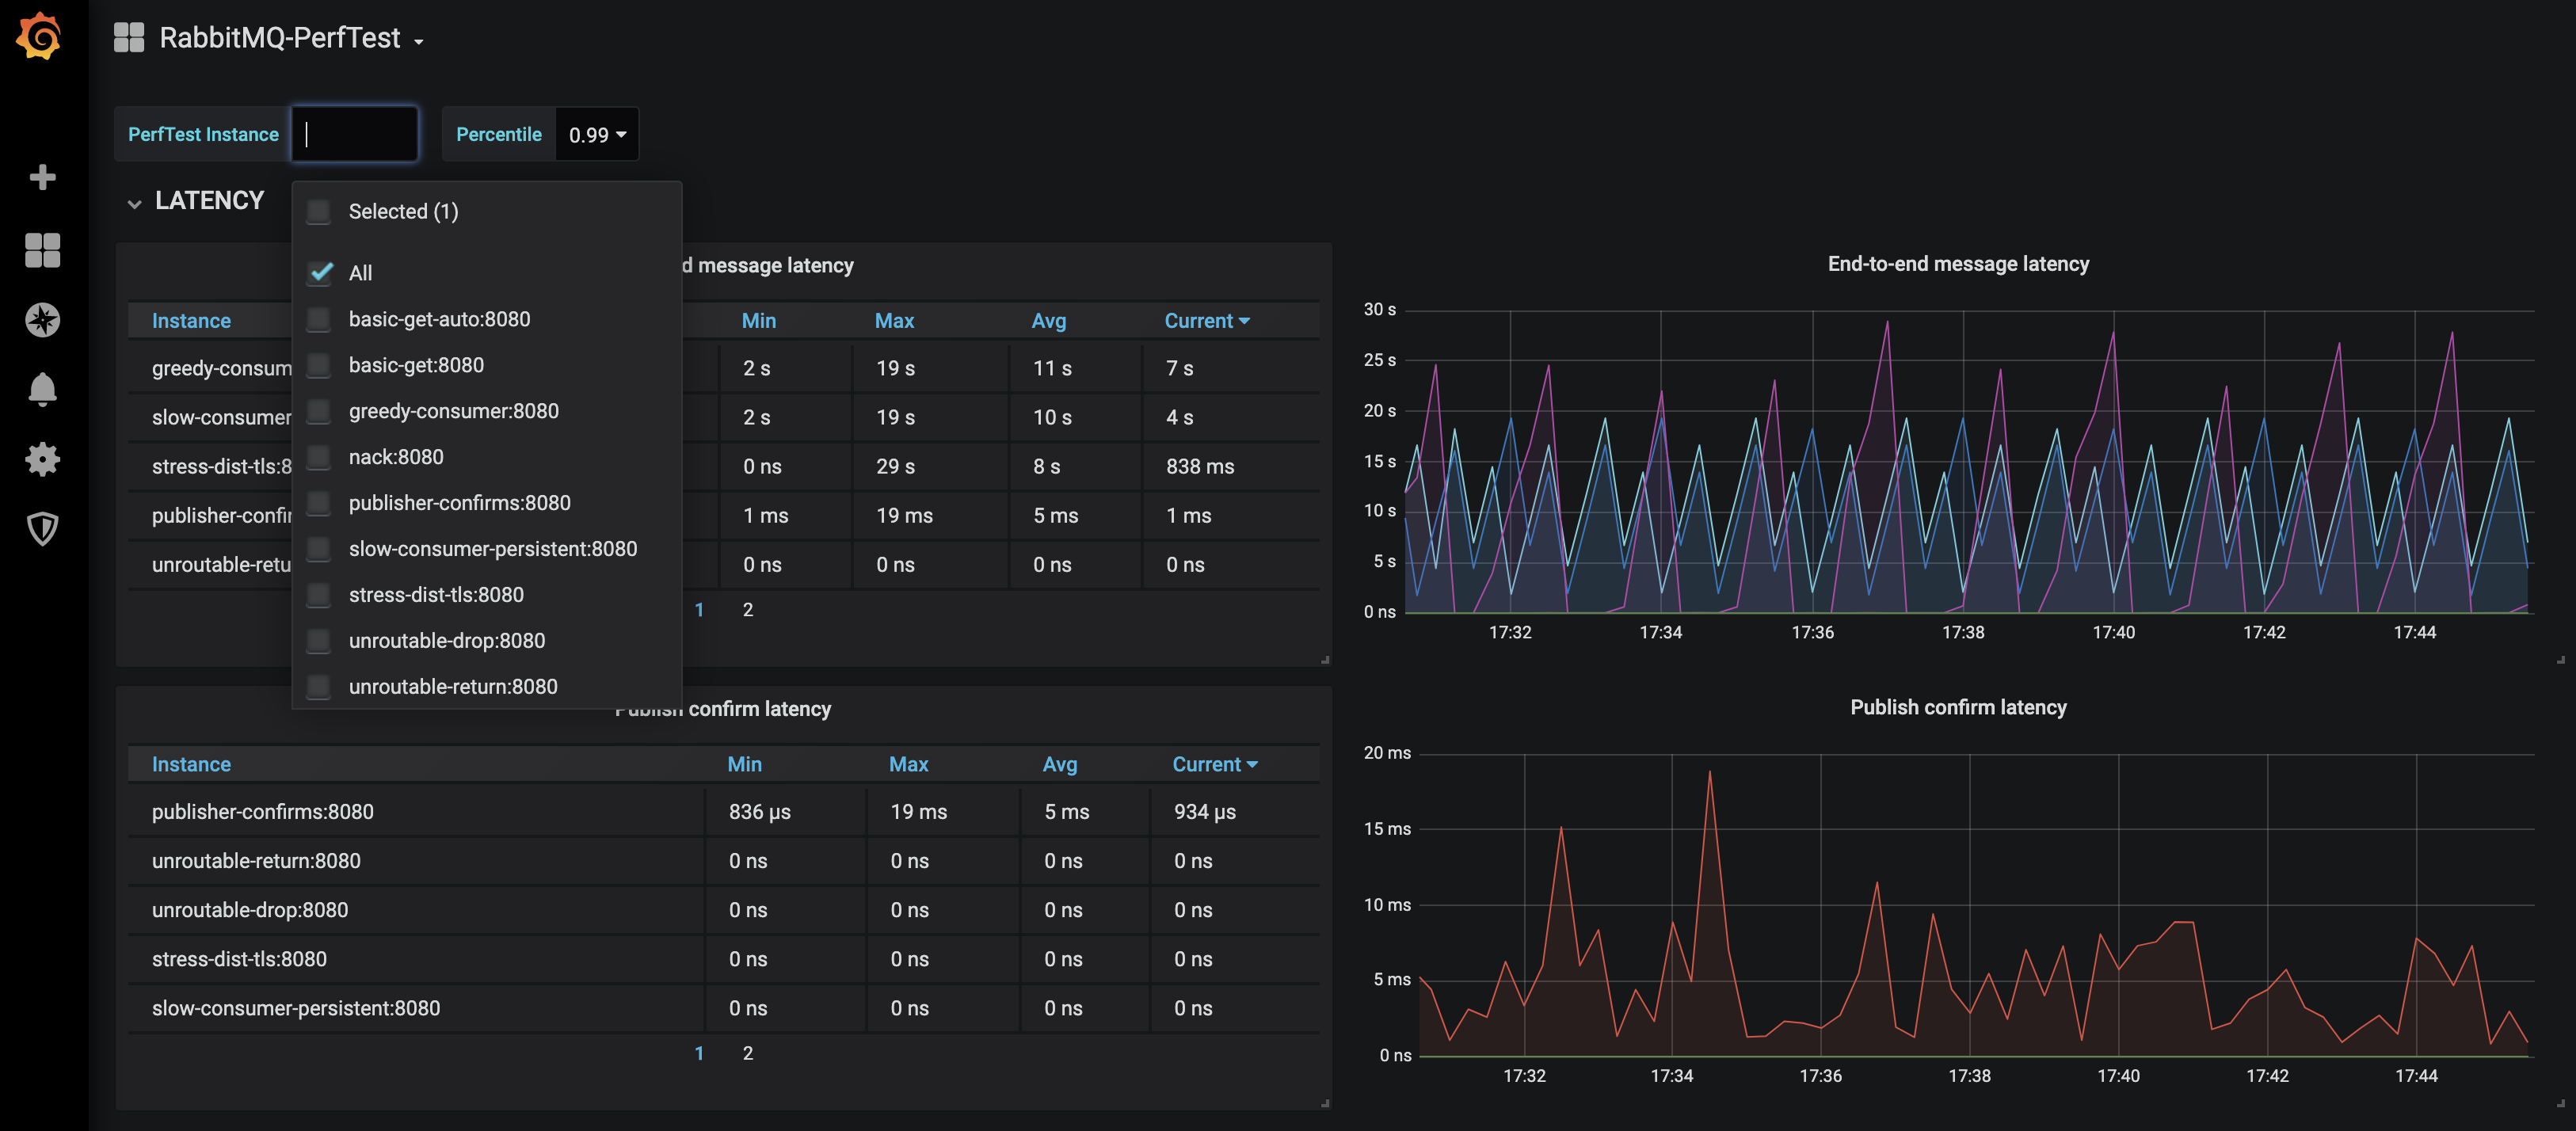
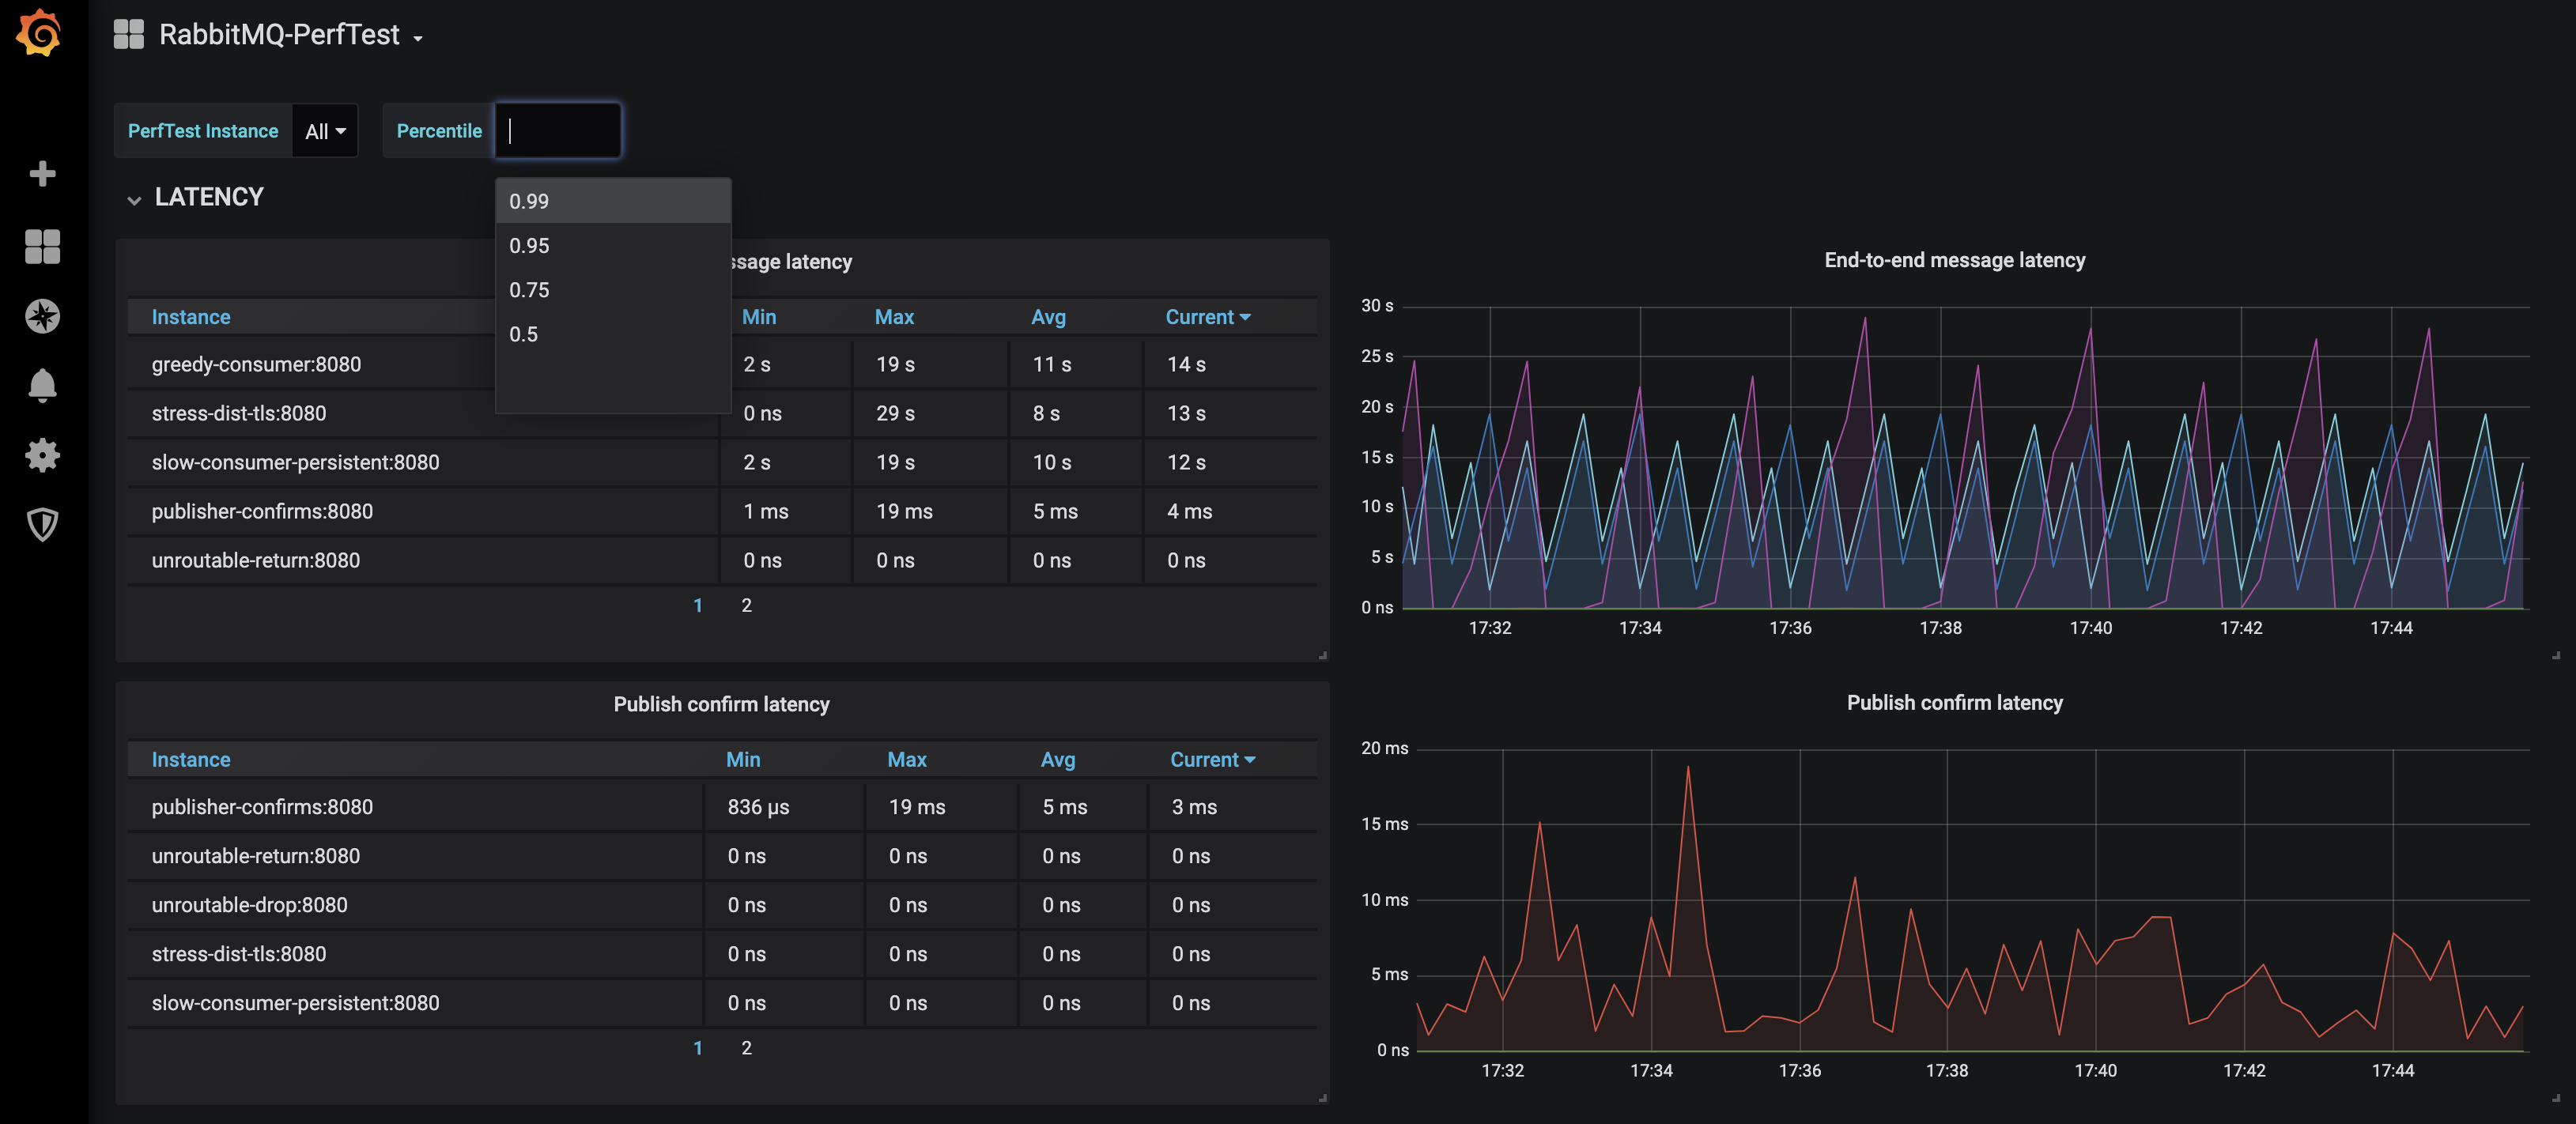
This dashboard monitors RabbitMQ performance metrics for end-to-end latency and publish/acknowledge flows, including latency distributions and throughput rates. It prominently tracks perftest_latency_seconds and perftest_confirm_latency_seconds to show timing across publish–consume cycles, along with throughput metrics like perftest_published, perftest_consumed, and perftest_confirmed to assess message flow and reliability. Latency distribution panels complement the time-series views, highlighting tail behavior and potential spikes, while nacked and returned counters help identify error conditions in message delivery.
Screenshots
Used Metrics 77
perftest_confirm_latency_seconds
perftest_confirmed
perftest_consumed
perftest_latency_seconds
perftest_nacked
perftest_published
perftest_returned