RabbitMQ Monitoring 64,90264,902
Description
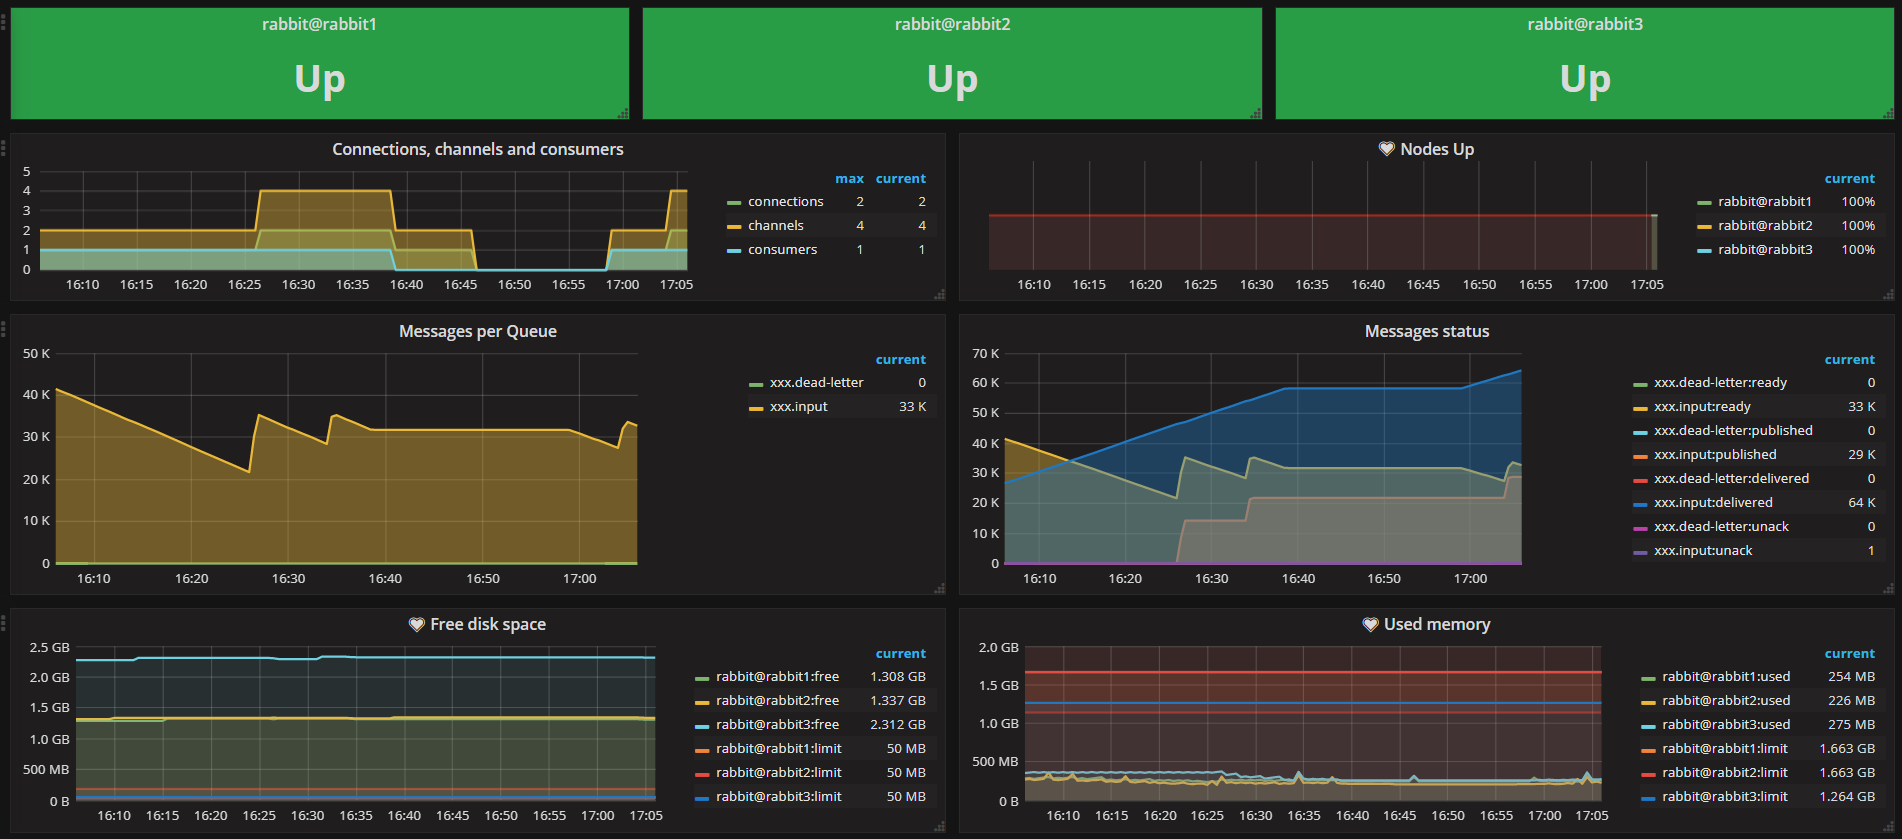
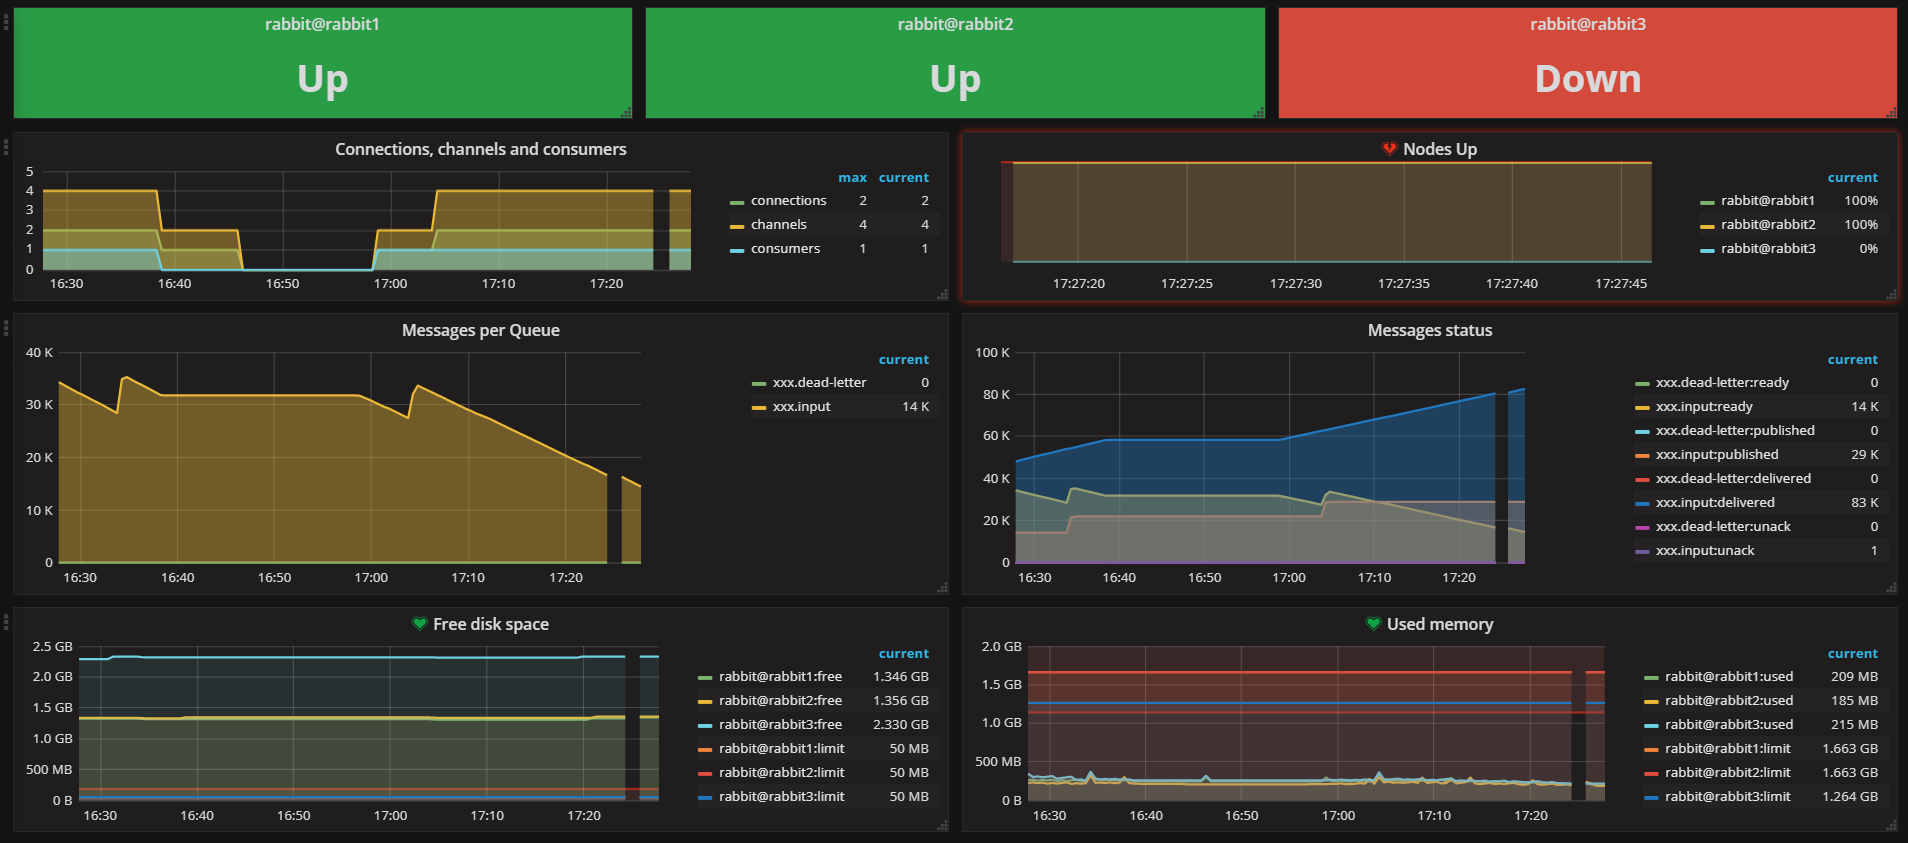
This dashboard provides end-to-end visibility into a RabbitMQ cluster, tracking node health, memory and disk thresholds, and the overall queueing activity. It highlights critical metrics like rabbitmq_running, rabbitmq_node_mem_alarm, and rabbitmq_queue_messages_ready to surface operational risk (memory/disk alarms) and workload dynamics (connections, channels, and queue messages). Key features include per-node status via $node, alerts for memory and disk limits, and detailed metrics on queue depth, consumers, and message throughput to help pinpoint bottlenecks and capacity issues.
Screenshots
Used Metrics 1515
rabbitmq_channels
rabbitmq_connections
rabbitmq_node_disk_free
rabbitmq_node_disk_free_alarm
rabbitmq_node_disk_free_limit
rabbitmq_node_mem_alarm
rabbitmq_node_mem_limit
rabbitmq_node_mem_used
rabbitmq_queue_consumers
rabbitmq_queue_messages
rabbitmq_queue_messages_delivered_total
rabbitmq_queue_messages_published_total
rabbitmq_queue_messages_ready
rabbitmq_queue_messages_unacknowledged
rabbitmq_running