RabbitMQ Connections Overview - Seventh State RabbitMQ Support 1,7701,770
3/15/2024
12/10/2024
4
RabbitMQ
>=10.4.0
Prometheus
Description
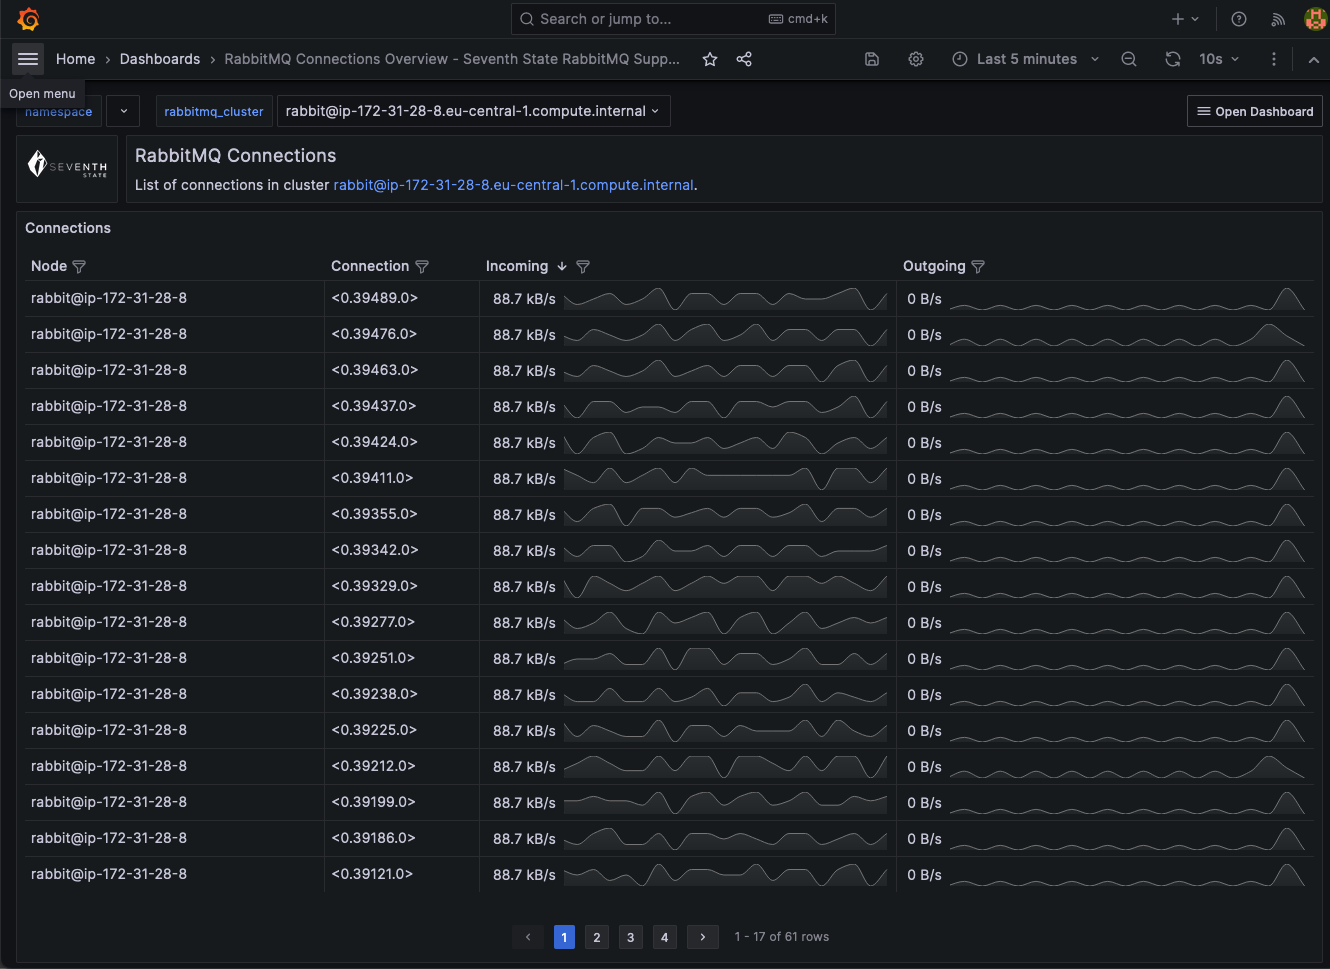
Overview of all connections in a RabbitMQ Cluster
Screenshots
Used Metrics 55
rabbitmq_cluster
rabbitmq_detailed_connection_incoming_bytes_total
rabbitmq_detailed_connection_outgoing_bytes_total
rabbitmq_identity_info
rabbitmq_node
Get Dashboard✕
Download
Copy to Clipboard