RabbitMQ Clusters - Seventh State RabbitMQ Support 1,4581,458
3/15/2024
4/3/2024
3
RabbitMQ
>=10.4.0
Prometheus
Description
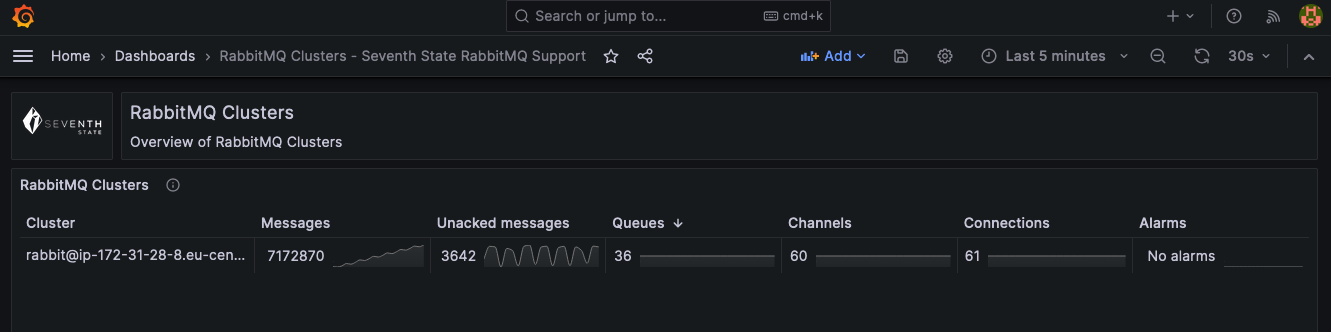
Screenshots
Used Metrics 1010
rabbitmq_alarms_file_descriptor_limit
rabbitmq_alarms_free_disk_space_watermark
rabbitmq_alarms_memory_used_watermark
rabbitmq_channel_messages_unacked
rabbitmq_channels
rabbitmq_cluster
rabbitmq_connections
rabbitmq_identity_info
rabbitmq_queue_messages
rabbitmq_queues
Get Dashboard✕
Download
Copy to Clipboard